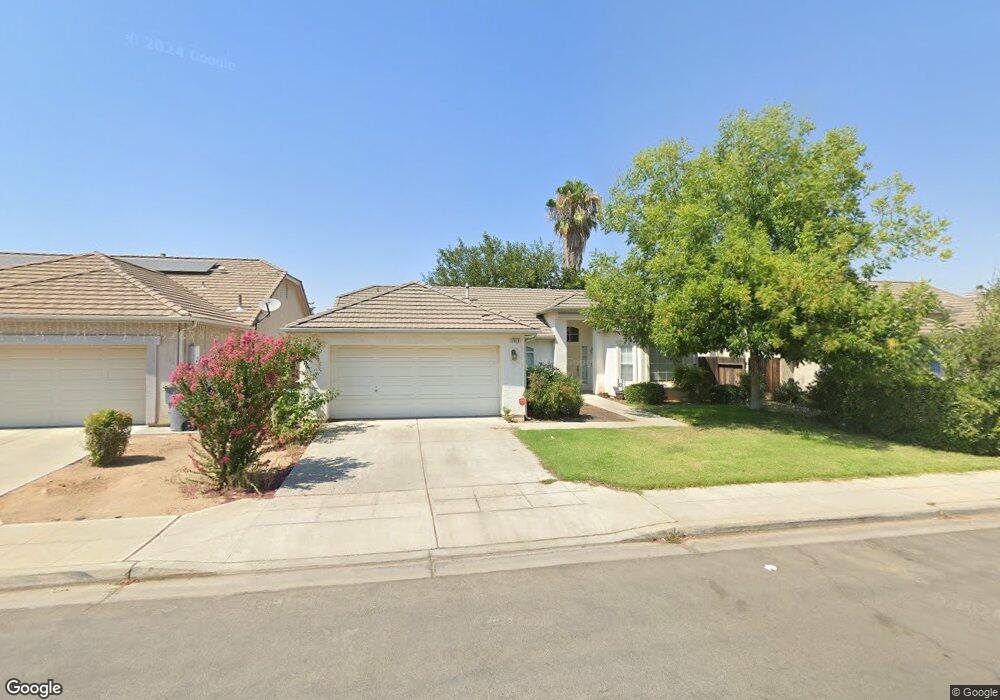
4540 W Roberts Ave Fresno, CA 93722
Fig Garden Loop NeighborhoodEstimated Value: $412,393 - $456,000
3
Beds
3
Baths
1,703
Sq Ft
$256/Sq Ft
Est. Value
About This Home
This home is located at 4540 W Roberts Ave, Fresno, CA 93722 and is currently estimated at $435,848, approximately $255 per square foot. 4540 W Roberts Ave is a home located in Fresno County with nearby schools including Lawless Elementary School, Tenaya Middle School, and Bullard High School.
Ownership History
Date
Name
Owned For
Owner Type
Purchase Details
Closed on
Feb 7, 2012
Sold by
Rezendes Maria F
Bought by
Rezendes Maria F
Current Estimated Value
Purchase Details
Closed on
Jan 9, 2004
Sold by
Brothers Rezendes
Bought by
Rezendes Raymond J and Rezendes Maria F
Purchase Details
Closed on
Nov 13, 2002
Sold by
Rezendes Richard A and Rezendes Maria C
Bought by
Rezendes Richard A and Rezendes Maria C
Purchase Details
Closed on
Feb 12, 2002
Sold by
Molina Javier and Molina Eleanor
Bought by
Brothers Rezendes and Rezendes Richard A
Purchase Details
Closed on
Jan 4, 2000
Sold by
Mc Caffrey Development L P
Bought by
Molina Javier and Molina Eleanor
Home Financials for this Owner
Home Financials are based on the most recent Mortgage that was taken out on this home.
Original Mortgage
$127,758
Interest Rate
7.72%
Mortgage Type
FHA
Create a Home Valuation Report for This Property
The Home Valuation Report is an in-depth analysis detailing your home's value as well as a comparison with similar homes in the area
Home Values in the Area
Average Home Value in this Area
Purchase History
| Date | Buyer | Sale Price | Title Company |
|---|---|---|---|
| Rezendes Maria F | -- | None Available | |
| Rezendes Raymond J | -- | -- | |
| Rezendes Richard A | -- | -- | |
| Rezendes Raymond J | -- | -- | |
| Brothers Rezendes | $157,000 | Chicago Title Co | |
| Molina Javier | $128,000 | Fidelity National Title Co |
Source: Public Records
Mortgage History
| Date | Status | Borrower | Loan Amount |
|---|---|---|---|
| Previous Owner | Molina Javier | $127,758 |
Source: Public Records
Tax History Compared to Growth
Tax History
| Year | Tax Paid | Tax Assessment Tax Assessment Total Assessment is a certain percentage of the fair market value that is determined by local assessors to be the total taxable value of land and additions on the property. | Land | Improvement |
|---|---|---|---|---|
| 2025 | $2,943 | $225,878 | $64,534 | $161,344 |
| 2023 | $2,884 | $217,109 | $62,029 | $155,080 |
| 2022 | $2,838 | $212,853 | $60,813 | $152,040 |
| 2021 | $2,758 | $208,680 | $59,621 | $149,059 |
| 2020 | $2,757 | $206,541 | $59,010 | $147,531 |
| 2019 | $2,648 | $202,492 | $57,853 | $144,639 |
| 2018 | $2,573 | $198,522 | $56,719 | $141,803 |
| 2017 | $2,563 | $194,630 | $55,607 | $139,023 |
| 2016 | $2,428 | $190,815 | $54,517 | $136,298 |
| 2015 | $2,403 | $187,950 | $53,699 | $134,251 |
| 2014 | $2,339 | $184,270 | $52,648 | $131,622 |
Source: Public Records
Map
Nearby Homes
- 4498 W Roberts Ave
- 4712 W Celeste Ave
- 4425 W Morris Ave
- 4713 W Morris Ave
- 4442 W Langden Dr
- 4438 W Langden Dr
- 4402 W Langden Dr Unit Lot19
- 4422 W Langden Dr Unit Lot14
- 4418 Langden Dr
- 4717 W Joline Dr
- 5432 N Salinas Ave
- 4531 W Malibu Ave
- 5319 N San Marcos Ave
- 5344 N Salinas Ave
- 6174 N Tracy Ave
- 5334 N Gates Ave
- 4088 W Fig Tree Ln
- 6296 N Lodi Ave
- 4043 W Fig Tree Ln
- 4171 W Avalon Ave
- 4532 W Roberts Ave
- 4548 W Roberts Ave
- 4539 W Oswego Ave
- 4547 W Oswego Ave
- 4524 W Roberts Ave
- 4556 W Roberts Ave
- 4531 W Oswego Ave
- 4555 W Oswego Ave
- 4535 W Roberts Ave
- 4543 W Roberts Ave
- 4527 W Roberts Ave
- 4523 W Oswego Ave
- 4516 W Roberts Ave
- 4564 W Roberts Ave
- 4551 W Roberts Ave
- 4563 W Oswego Ave
- 4519 W Roberts Ave
- 4559 W Roberts Ave
- 4515 W Oswego Ave
- 4508 W Roberts Ave