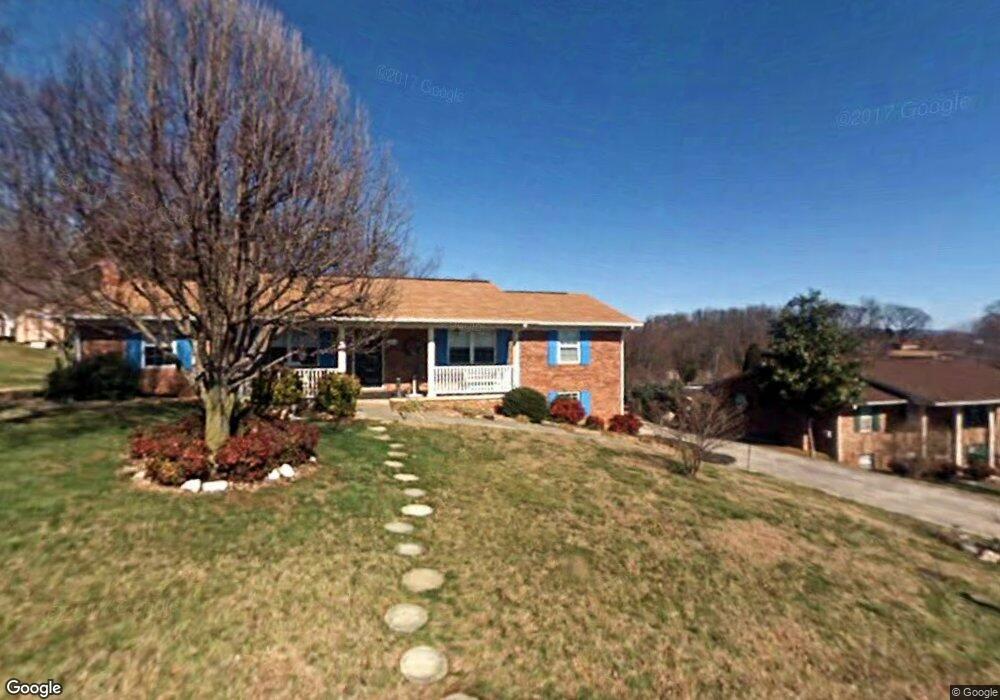
4541 Birchwood Cir Morristown, TN 37814
Estimated Value: $247,024 - $320,000
--
Bed
2
Baths
1,560
Sq Ft
$181/Sq Ft
Est. Value
About This Home
This home is located at 4541 Birchwood Cir, Morristown, TN 37814 and is currently estimated at $282,756, approximately $181 per square foot. 4541 Birchwood Cir is a home located in Hamblen County with nearby schools including Russellville Elementary School, East Ridge Middle School, and Morristown East High School.
Ownership History
Date
Name
Owned For
Owner Type
Purchase Details
Closed on
Aug 22, 2014
Sold by
Morilak John H
Bought by
Morilak Katherine A
Current Estimated Value
Home Financials for this Owner
Home Financials are based on the most recent Mortgage that was taken out on this home.
Original Mortgage
$103,300
Outstanding Balance
$79,030
Interest Rate
4.2%
Mortgage Type
VA
Estimated Equity
$203,726
Purchase Details
Closed on
Apr 7, 1997
Sold by
Hartsfield Jimmie C
Bought by
John Morilak
Purchase Details
Closed on
Oct 21, 1992
Bought by
Hartsfield Jimmie C and Hartsfield Phyllis D
Purchase Details
Closed on
Sep 9, 1989
Bought by
Blake Michael E and Blake Denise J
Purchase Details
Closed on
Jun 9, 1986
Bought by
Burgess John Thomas and Vicki Tucker
Purchase Details
Closed on
Nov 21, 1980
Bought by
Cxlifford Joseph M and Cxlifford Mary C
Create a Home Valuation Report for This Property
The Home Valuation Report is an in-depth analysis detailing your home's value as well as a comparison with similar homes in the area
Home Values in the Area
Average Home Value in this Area
Purchase History
| Date | Buyer | Sale Price | Title Company |
|---|---|---|---|
| Morilak Katherine A | $100,000 | -- | |
| John Morilak | $87,000 | -- | |
| Hartsfield Jimmie C | $72,200 | -- | |
| Blake Michael E | $64,900 | -- | |
| Burgess John Thomas | $60,700 | -- | |
| Cxlifford Joseph M | -- | -- |
Source: Public Records
Mortgage History
| Date | Status | Borrower | Loan Amount |
|---|---|---|---|
| Open | Morilak Katherine A | $103,300 |
Source: Public Records
Tax History Compared to Growth
Tax History
| Year | Tax Paid | Tax Assessment Tax Assessment Total Assessment is a certain percentage of the fair market value that is determined by local assessors to be the total taxable value of land and additions on the property. | Land | Improvement |
|---|---|---|---|---|
| 2024 | $682 | $34,625 | $4,550 | $30,075 |
| 2023 | $682 | $34,625 | $0 | $0 |
| 2022 | $682 | $34,625 | $4,550 | $30,075 |
| 2021 | $682 | $34,625 | $4,550 | $30,075 |
| 2020 | $682 | $34,625 | $4,550 | $30,075 |
| 2019 | $626 | $29,375 | $4,050 | $25,325 |
| 2018 | $626 | $29,375 | $4,050 | $25,325 |
| 2017 | $626 | $29,375 | $4,050 | $25,325 |
| 2016 | $585 | $29,375 | $4,050 | $25,325 |
| 2015 | $543 | $29,375 | $4,050 | $25,325 |
| 2014 | -- | $29,375 | $4,050 | $25,325 |
| 2013 | -- | $33,675 | $0 | $0 |
Source: Public Records
Map
Nearby Homes
- 4475 Copeland Dr
- 4146 Leslie Dr
- 1881 Raven Rd
- 3835 High Oak Dr
- 1708 Boardwalk Cir
- 3800 Dan Dr
- 5110 Anne Cir
- 1134 Shannons Little Mountain Rd
- 3646 Falcon Rd
- 5085 Old Kentucky Rd
- 4959 Brights Pike
- 4027 White Wood Cir
- 4091 White Wood Cir
- 5556 Denton Dr
- 3409 Copper Ridge Rd
- 4547 Brights Pike
- 2551 Cedar Creek Rd
- 354 Volunteer Dr
- 4119 Azalea Ct
- 4551 Birchwood Cir
- 4511 Birchwood Cir
- 4561 Birchwood Cir
- 4532 Birchwood Cir
- 4562 Birchwood Cir
- 4512 Birchwood Cir
- 4522 Birchwood Cir
- 1831 Green Hill Dr
- 4513 Birchwood Cir
- 2125 Lawson Rd
- 4572 Birchwood Cir
- 4465 Copeland Cir
- 1841 Green Hill Dr
- 4515 Birchwood Cir
- 4455 Copeland Dr
- 4455 Copeland Cir
- 4475 Copeland Cir
- 4495 Copeland Cir
- 1812 Green Hill Dr
- 1822 Green Hill Dr