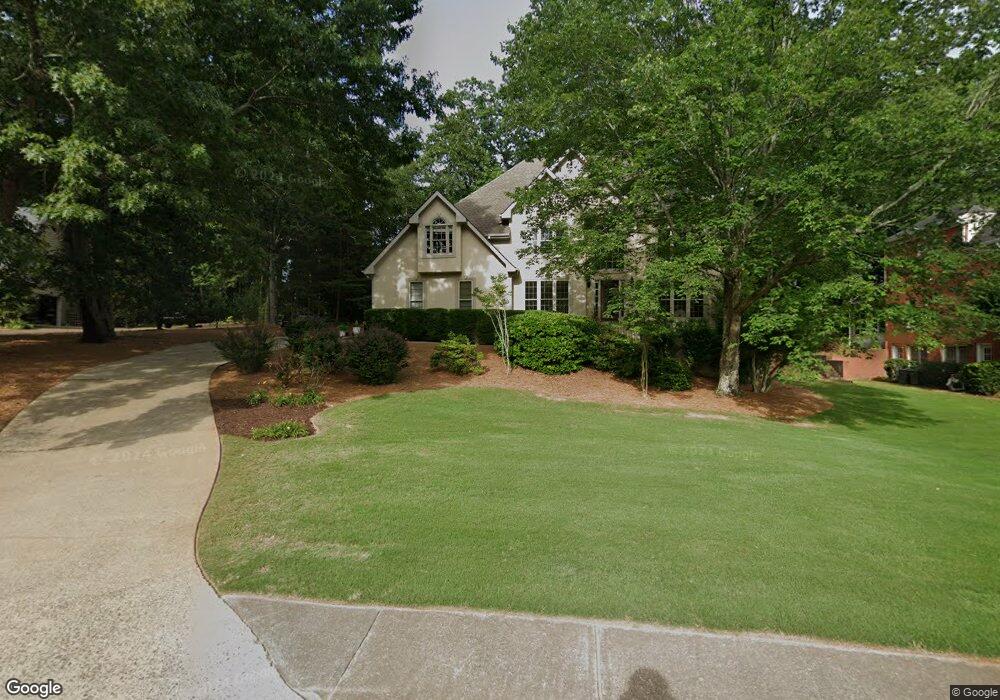
4541 Forest Peak Cir Unit 2 Marietta, GA 30066
Sandy Plains NeighborhoodEstimated Value: $644,000 - $811,000
4
Beds
3
Baths
2,896
Sq Ft
$250/Sq Ft
Est. Value
About This Home
This home is located at 4541 Forest Peak Cir Unit 2, Marietta, GA 30066 and is currently estimated at $723,896, approximately $249 per square foot. 4541 Forest Peak Cir Unit 2 is a home located in Cobb County with nearby schools including Davis Elementary School, Mabry Middle School, and Lassiter High School.
Ownership History
Date
Name
Owned For
Owner Type
Purchase Details
Closed on
Oct 28, 2011
Sold by
Culkin Cynthia D
Bought by
Culkin Kevin J
Current Estimated Value
Purchase Details
Closed on
Jul 16, 2001
Sold by
Wilson Jeffrey M and Wilson Rhonda S
Bought by
Culkin Kevin J and Culkin Cynthia D
Home Financials for this Owner
Home Financials are based on the most recent Mortgage that was taken out on this home.
Original Mortgage
$200,000
Interest Rate
7.19%
Mortgage Type
New Conventional
Purchase Details
Closed on
Dec 29, 2000
Sold by
O'Neill Timothy J
Bought by
Wilson Jeffrey M and Wilson Rhonda S
Home Financials for this Owner
Home Financials are based on the most recent Mortgage that was taken out on this home.
Original Mortgage
$225,600
Interest Rate
7.75%
Mortgage Type
New Conventional
Create a Home Valuation Report for This Property
The Home Valuation Report is an in-depth analysis detailing your home's value as well as a comparison with similar homes in the area
Home Values in the Area
Average Home Value in this Area
Purchase History
| Date | Buyer | Sale Price | Title Company |
|---|---|---|---|
| Culkin Kevin J | -- | -- | |
| Culkin Kevin J | $312,900 | -- | |
| Wilson Jeffrey M | $282,000 | -- |
Source: Public Records
Mortgage History
| Date | Status | Borrower | Loan Amount |
|---|---|---|---|
| Previous Owner | Culkin Kevin J | $200,000 | |
| Previous Owner | Wilson Jeffrey M | $225,600 |
Source: Public Records
Tax History Compared to Growth
Tax History
| Year | Tax Paid | Tax Assessment Tax Assessment Total Assessment is a certain percentage of the fair market value that is determined by local assessors to be the total taxable value of land and additions on the property. | Land | Improvement |
|---|---|---|---|---|
| 2025 | $1,645 | $248,472 | $60,000 | $188,472 |
| 2024 | $1,650 | $248,472 | $60,000 | $188,472 |
| 2023 | $1,444 | $248,472 | $60,000 | $188,472 |
| 2022 | $1,524 | $206,368 | $40,000 | $166,368 |
| 2021 | $1,439 | $177,892 | $40,000 | $137,892 |
| 2020 | $1,439 | $177,892 | $40,000 | $137,892 |
| 2019 | $1,439 | $177,892 | $40,000 | $137,892 |
| 2018 | $1,364 | $152,792 | $36,800 | $115,992 |
| 2017 | $3,896 | $152,792 | $36,800 | $115,992 |
| 2016 | $3,605 | $139,416 | $31,600 | $107,816 |
| 2015 | $3,689 | $139,416 | $31,600 | $107,816 |
| 2014 | $3,717 | $139,416 | $0 | $0 |
Source: Public Records
Map
Nearby Homes
- 4243 N Mountain Rd NE
- 4734 Outlook Way NE
- 4380 Wood Creek Dr
- 4219 N Mountain Rd NE
- 4302 Highborne Dr NE Unit 3
- 3465 Township Ridge Point
- 3333 Devaughn Dr NE
- 4563 Ashmore Cir NE
- 4397 Windsor Oaks Cir
- 130 Cherecobb Dr
- 3870 Sweat Creek Run
- 3350 Brookhill Cir
- 4589 Wigley Estates Rd
- 3043 Sawyer Trace NE
- 4019 Wesley Chapel Rd
- 146 Bellehaven Dr
- 415 Bellehaven Ln
- 920 Lucky Ln
- 4543 Forest Peak Cir
- 4539 Forest Peak Cir
- 4515 Outlook Dr NE
- 4517 Outlook Dr NE
- 4545 Forest Peak Cir Unit 2
- 4542 Forest Peak Cir Unit 2
- 4519 Outlook Dr NE Unit 2
- 4537 Forest Peak Cir
- 3650 Lone Indian Trail
- 4513 Outlook Dr NE
- 4547 Forest Peak Cir Unit 2
- 4511 Outlook Dr NE Unit 2
- 4540 Forest Peak Cir
- 3648 Lone Indian Trail
- 4535 Forest Peak Cir
- 4516 Outlook Dr NE
- 4521 Outlook Dr NE Unit 2
- 4660 E Forest Peak
- 4546 Forest Peak Cir
- 4666 E Forest Peak Unit 2