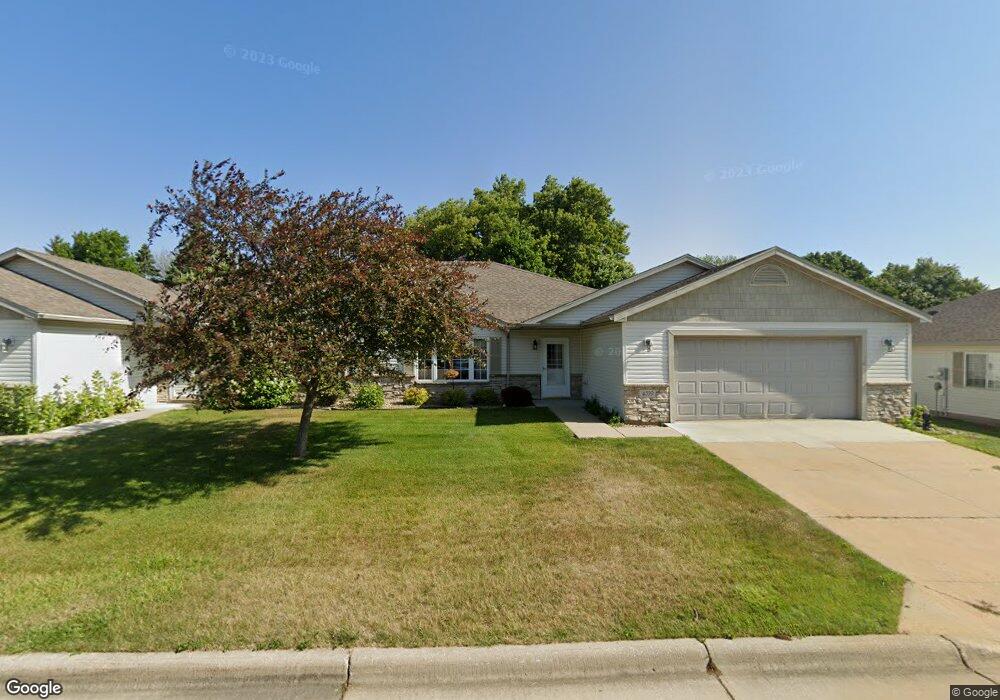
4541 Meadow Lakes Ln NW Rochester, MN 55901
The Manor NeighborhoodEstimated Value: $274,532 - $294,000
2
Beds
2
Baths
1,278
Sq Ft
$222/Sq Ft
Est. Value
About This Home
This home is located at 4541 Meadow Lakes Ln NW, Rochester, MN 55901 and is currently estimated at $284,133, approximately $222 per square foot. 4541 Meadow Lakes Ln NW is a home located in Olmsted County with nearby schools including Bishop Elementary School, John Adams Middle School, and John Marshall Senior High School.
Ownership History
Date
Name
Owned For
Owner Type
Purchase Details
Closed on
Mar 3, 2021
Sold by
Peters Ronald E and Peters Gloria J
Bought by
Quach Brandon
Current Estimated Value
Home Financials for this Owner
Home Financials are based on the most recent Mortgage that was taken out on this home.
Original Mortgage
$184,000
Outstanding Balance
$150,792
Interest Rate
2.7%
Mortgage Type
New Conventional
Estimated Equity
$133,341
Purchase Details
Closed on
Jan 4, 2018
Sold by
Matzke Rosemary
Bought by
Peters Ronald E and Peters Gloria J
Purchase Details
Closed on
Jan 3, 2018
Sold by
Matzke George E and Lewis Susan
Bought by
Peters Ronald E and Peters Gloria J
Purchase Details
Closed on
Aug 8, 2017
Sold by
Martke Rosemary A
Bought by
Martzke George E
Create a Home Valuation Report for This Property
The Home Valuation Report is an in-depth analysis detailing your home's value as well as a comparison with similar homes in the area
Home Values in the Area
Average Home Value in this Area
Purchase History
| Date | Buyer | Sale Price | Title Company |
|---|---|---|---|
| Quach Brandon | $233,030 | Rochester Title | |
| Peters Ronald E | $184,000 | Partners Title Llc | |
| Peters Ronald E | -- | Partners Title Llc | |
| Martzke George E | -- | None Available | |
| Quach Brandon Brandon | $230,000 | -- |
Source: Public Records
Mortgage History
| Date | Status | Borrower | Loan Amount |
|---|---|---|---|
| Open | Quach Brandon | $184,000 | |
| Closed | Quach Brandon Brandon | $184,000 |
Source: Public Records
Tax History Compared to Growth
Tax History
| Year | Tax Paid | Tax Assessment Tax Assessment Total Assessment is a certain percentage of the fair market value that is determined by local assessors to be the total taxable value of land and additions on the property. | Land | Improvement |
|---|---|---|---|---|
| 2024 | $2,922 | $230,100 | $30,000 | $200,100 |
| 2023 | $2,686 | $227,600 | $30,000 | $197,600 |
| 2022 | $2,708 | $214,700 | $30,000 | $184,700 |
| 2021 | $2,358 | $196,800 | $30,000 | $166,800 |
| 2020 | $2,346 | $188,500 | $30,000 | $158,500 |
| 2019 | $2,174 | $181,300 | $30,000 | $151,300 |
| 2018 | $1,870 | $170,700 | $20,000 | $150,700 |
| 2017 | $1,786 | $155,500 | $16,800 | $138,700 |
| 2016 | $1,826 | $118,500 | $13,900 | $104,600 |
| 2015 | $863 | $118,900 | $13,900 | $105,000 |
| 2014 | $1,722 | $120,500 | $14,000 | $106,500 |
| 2012 | -- | $122,700 | $14,052 | $108,648 |
Source: Public Records
Map
Nearby Homes
- 4444 3rd St NW
- 4822 3rd St NW
- 4339 Manor Park Dr NW
- 4992 4th St NW
- 4036 3rd St NW
- 4119 Manor View Dr NW
- 3938 7th St NW
- 828 Diamond Ridge Ln NW
- 3586 6th St NW
- 3740 8th St NW
- 650 36th Ave NW
- 660 36th Ave NW
- 3555 6th St NW
- 4921 8th St SW
- 3415 Lake St NW
- 468 Panorama Cir NW
- 4700 Country Club Rd SW
- 4541 Ruby Ln NW
- 700 Panorama Cir NW
- 5470 Saint Mary Dr NW
- 4539 Meadow Lakes Ln NW
- 4527 Meadow Lakes Ln NW
- 4516 3rd St NW
- 4552 Meadow Lakes Ln NW
- 4540 Meadow Lakes Ln NW
- 4524 3rd St NW
- 4554 Meadow Lakes Ln NW
- 4508 3rd St NW
- 4525 Meadow Lakes Ln NW
- 4538 Meadow Lakes Ln NW
- 4576 Meadow Lakes Ln NW
- 4578 Meadow Lakes Ln NW
- 4532 3rd St NW
- 4526 Meadow Lakes Ln NW
- 4502 3rd St NW
- 4513 Meadow Lakes Ln NW
- 4543 Prairie View Place NW
- 4555 Prairie View Place NW
- 4524 Meadow Lakes Ln NW
- 4557 Prairie View Place NW