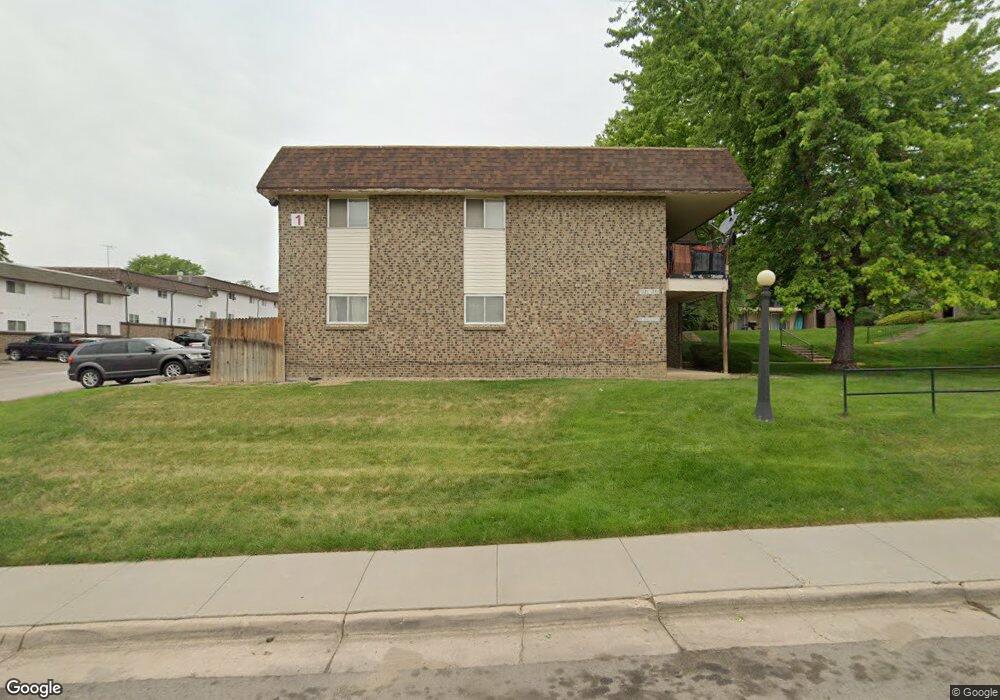
4541 S Lowell Blvd Unit 30 Denver, CO 80236
Fort Logan NeighborhoodEstimated Value: $234,000 - $291,000
3
Beds
2
Baths
1,104
Sq Ft
$234/Sq Ft
Est. Value
About This Home
This home is located at 4541 S Lowell Blvd Unit 30, Denver, CO 80236 and is currently estimated at $258,480, approximately $234 per square foot. 4541 S Lowell Blvd Unit 30 is a home located in Denver County with nearby schools including Kaiser Elementary School, Bear Valley International School, and John F Kennedy High School.
Ownership History
Date
Name
Owned For
Owner Type
Purchase Details
Closed on
Jun 3, 2002
Sold by
Schumann Curtis Christian and Schumann Curtis Sarah
Bought by
Joseph Saleem and Joseph Shahrukh S
Current Estimated Value
Home Financials for this Owner
Home Financials are based on the most recent Mortgage that was taken out on this home.
Original Mortgage
$117,050
Outstanding Balance
$49,771
Interest Rate
6.89%
Mortgage Type
FHA
Estimated Equity
$208,709
Purchase Details
Closed on
May 21, 1998
Sold by
Gonzales Michelle Lynnette
Bought by
Schumann Curtis Christian and Schumann Curtis Sarah
Home Financials for this Owner
Home Financials are based on the most recent Mortgage that was taken out on this home.
Original Mortgage
$74,650
Interest Rate
7.22%
Mortgage Type
FHA
Purchase Details
Closed on
Sep 29, 1994
Sold by
Duncan Ronald M and Duncan Percy E
Bought by
Gonzales Michelle Lynnette
Create a Home Valuation Report for This Property
The Home Valuation Report is an in-depth analysis detailing your home's value as well as a comparison with similar homes in the area
Home Values in the Area
Average Home Value in this Area
Purchase History
| Date | Buyer | Sale Price | Title Company |
|---|---|---|---|
| Joseph Saleem | $119,900 | Land Title | |
| Schumann Curtis Christian | $77,000 | -- | |
| Gonzales Michelle Lynnette | $48,000 | -- |
Source: Public Records
Mortgage History
| Date | Status | Borrower | Loan Amount |
|---|---|---|---|
| Open | Joseph Saleem | $117,050 | |
| Previous Owner | Schumann Curtis Christian | $74,650 |
Source: Public Records
Tax History Compared to Growth
Tax History
| Year | Tax Paid | Tax Assessment Tax Assessment Total Assessment is a certain percentage of the fair market value that is determined by local assessors to be the total taxable value of land and additions on the property. | Land | Improvement |
|---|---|---|---|---|
| 2024 | $1,110 | $14,010 | $1,390 | $12,620 |
| 2023 | $1,086 | $14,010 | $1,390 | $12,620 |
| 2022 | $1,125 | $14,150 | $1,440 | $12,710 |
| 2021 | $1,086 | $14,560 | $1,480 | $13,080 |
| 2020 | $1,015 | $13,680 | $1,480 | $12,200 |
| 2019 | $987 | $13,680 | $1,480 | $12,200 |
| 2018 | $745 | $9,630 | $1,360 | $8,270 |
| 2017 | $743 | $9,630 | $1,360 | $8,270 |
| 2016 | $594 | $7,280 | $1,504 | $5,776 |
| 2015 | $569 | $7,280 | $1,504 | $5,776 |
| 2014 | $429 | $5,170 | $971 | $4,199 |
Source: Public Records
Map
Nearby Homes
- 4569 S Lowell Blvd Unit B
- 4445 S Lowell Blvd
- 3831 W Rutgers Place
- 4639 S Lowell Blvd Unit B
- 4641 S Lowell Blvd Unit D
- 4643 S Lowell Blvd Unit B
- 4621 S Lowell Blvd Unit J6
- 3659 W Union Ave Unit F4
- 3713 W Union Ave
- 3590 W Pimlico Ave
- 3395 W Union Ave
- 3379 W Wagon Trail Dr
- 4095 W Radcliff Ave
- 3288 W Tufts Ave
- 4155 W Stanford Ave
- 4090 W Wagon Trail Dr
- 4749 S Irving St
- 4201 W Tufts Ave
- 4415 S Tennyson St
- 4244 W Monmouth Ave
- 4599 S Lowell Blvd Unit D
- 4599 S Lowell Blvd Unit C
- 4599 S Lowell Blvd Unit A
- 4599 S Lowell Blvd Unit B
- 4599 S Lowell Blvd
- 4567 S Lowell Blvd
- 4567 S Lowell Blvd Unit 15
- 4567 S Lowell Blvd
- 4567 S Lowell Blvd
- 4541 S Lowell Blvd Unit 29
- 4537 S Lowell Blvd Unit 26
- 4537 S Lowell Blvd
- 4537 S Lowell Blvd
- 4535 S Lowell Blvd Unit 23
- 4533 S Lowell Blvd Unit 22
- 4533 S Lowell Blvd Unit 21
- 4533 S Lowell Blvd
- 4531 S Lowell Blvd
- 4531 S Lowell Blvd
- 4541 S Lowell Blvd Unit 15