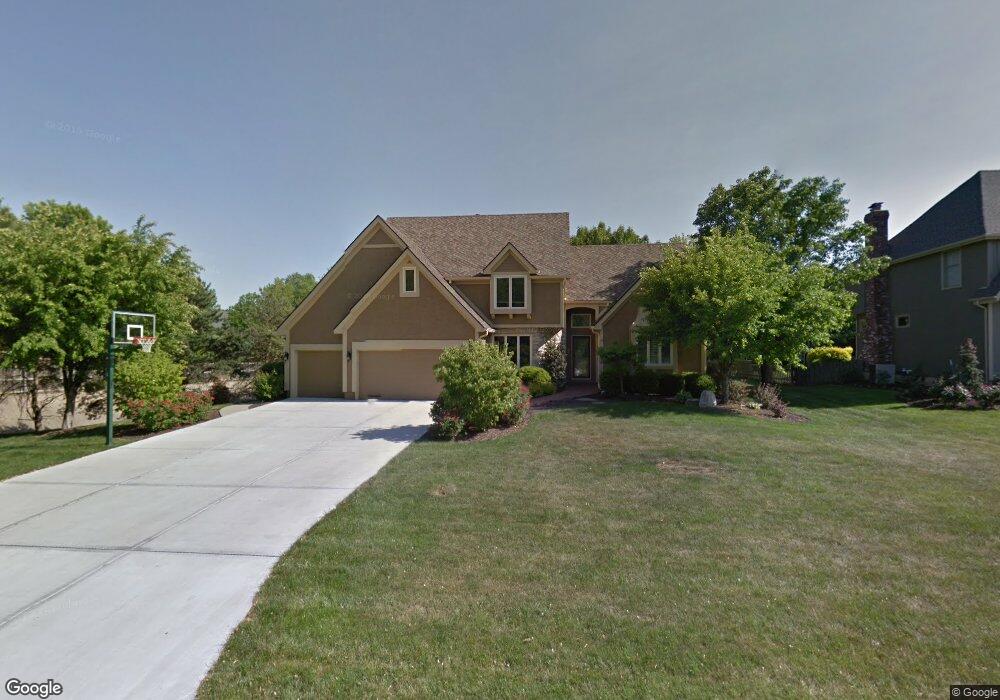
4541 W 138th Terrace Overland Park, KS 66224
Estimated Value: $724,000 - $880,000
4
Beds
5
Baths
2,900
Sq Ft
$272/Sq Ft
Est. Value
About This Home
This home is located at 4541 W 138th Terrace, Overland Park, KS 66224 and is currently estimated at $790,042, approximately $272 per square foot. 4541 W 138th Terrace is a home located in Johnson County with nearby schools including Prairie Star Elementary School, Prairie Star Middle School, and Blue Valley High School.
Ownership History
Date
Name
Owned For
Owner Type
Purchase Details
Closed on
Sep 13, 2011
Sold by
Krumm Patrick J and Krumm Christa L
Bought by
Warren Matthew M and Warren Amy L
Current Estimated Value
Home Financials for this Owner
Home Financials are based on the most recent Mortgage that was taken out on this home.
Original Mortgage
$250,000
Outstanding Balance
$172,582
Interest Rate
4.43%
Mortgage Type
New Conventional
Estimated Equity
$617,460
Purchase Details
Closed on
Jul 16, 2003
Sold by
Krumm Patrick J and Krumm Christa
Bought by
Krumm Patrick J and Krumm Christa
Home Financials for this Owner
Home Financials are based on the most recent Mortgage that was taken out on this home.
Original Mortgage
$244,000
Interest Rate
4.57%
Mortgage Type
Purchase Money Mortgage
Purchase Details
Closed on
Jul 1, 2002
Sold by
Krumm Patrick J and Krumm Christa
Bought by
Krumm Patrick J and Krumm Christa
Create a Home Valuation Report for This Property
The Home Valuation Report is an in-depth analysis detailing your home's value as well as a comparison with similar homes in the area
Home Values in the Area
Average Home Value in this Area
Purchase History
| Date | Buyer | Sale Price | Title Company |
|---|---|---|---|
| Warren Matthew M | -- | Kansas City Title Inc | |
| Krumm Patrick J | -- | -- | |
| Krumm Patrick J | -- | -- | |
| Krumm Patrick J | -- | -- |
Source: Public Records
Mortgage History
| Date | Status | Borrower | Loan Amount |
|---|---|---|---|
| Open | Warren Matthew M | $250,000 | |
| Previous Owner | Krumm Patrick J | $244,000 |
Source: Public Records
Tax History Compared to Growth
Tax History
| Year | Tax Paid | Tax Assessment Tax Assessment Total Assessment is a certain percentage of the fair market value that is determined by local assessors to be the total taxable value of land and additions on the property. | Land | Improvement |
|---|---|---|---|---|
| 2024 | $8,542 | $76,636 | $15,709 | $60,927 |
| 2023 | $8,019 | $71,059 | $15,709 | $55,350 |
| 2022 | $7,469 | $64,814 | $15,709 | $49,105 |
| 2021 | $7,469 | $60,824 | $15,709 | $45,115 |
| 2020 | $7,802 | $63,319 | $15,709 | $47,610 |
| 2019 | $7,898 | $62,951 | $13,656 | $49,295 |
| 2018 | $7,938 | $62,135 | $12,404 | $49,731 |
| 2017 | $7,521 | $57,903 | $10,784 | $47,119 |
| 2016 | $7,806 | $60,145 | $10,784 | $49,361 |
| 2015 | $7,693 | $58,558 | $10,784 | $47,774 |
| 2013 | -- | $56,626 | $9,788 | $46,838 |
Source: Public Records
Map
Nearby Homes
- 4512 W 139th St
- 4520 W 140th St
- 3811 W 138th St
- 13614 Granada Dr
- 13611 Granada Dr
- 4419 W 137th St
- 13804 Alhambra St
- 13623 Granada Dr
- 13626 Granada Dr
- 14004 Linden St
- 4407 W 136th Terrace
- 4403 W 136th Terrace
- 4410 W 136th Terrace
- 13610 Granada Dr
- 13622 Granada Dr
- 13602 Granada Dr
- 13619 Granada Dr
- 3849 W 139th Terrace
- 4406 W 136th Terrace
- 4423 W 136th St
- 4545 W 138th Terrace
- 13808 Fontana St
- 13812 Fontana St
- 4508 W 139th St
- 13900 Fontana St
- 4504 W 139th St
- 4540 W 138th Terrace
- 4549 W 138th Terrace
- 4544 W 138th Terrace
- 4516 W 139th St
- 13904 Fontana St
- 13804 Fontana Ln
- 4548 W 138th Terrace
- 4520 W 139th St
- 13813 Fontana St
- 13809 Fontana St
- 4500 W 139th St
- 4501 W 138th St
- 13908 Fontana St
- 13901 Fontana St