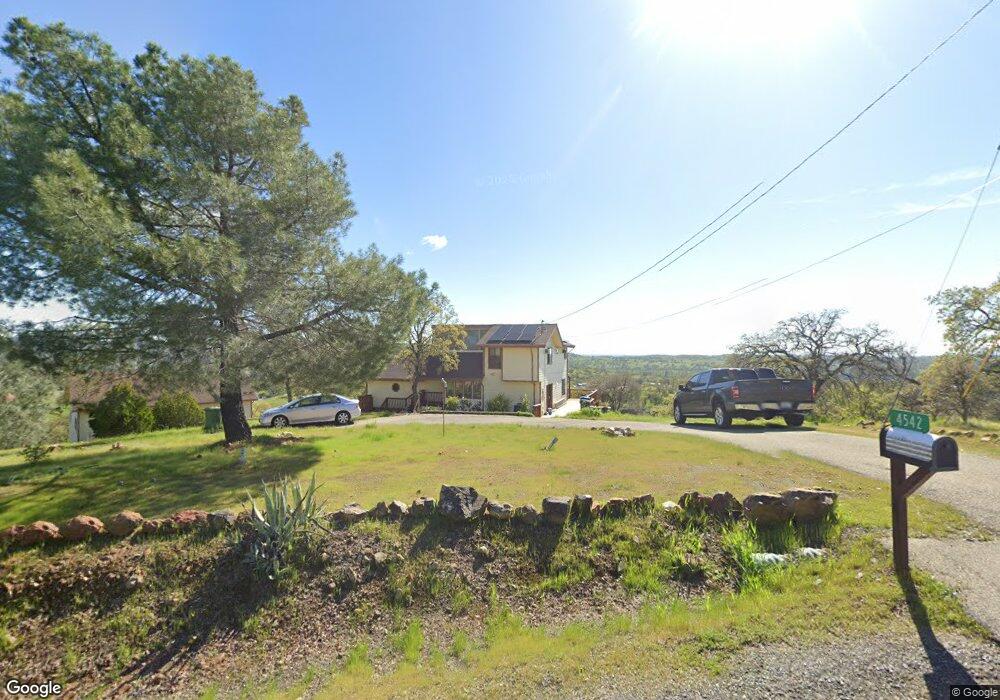
4542 Enramada Dr Unit 1358 La Grange, CA 95329
Estimated Value: $419,000 - $578,000
3
Beds
4
Baths
3,200
Sq Ft
$162/Sq Ft
Est. Value
About This Home
This home is located at 4542 Enramada Dr Unit 1358, La Grange, CA 95329 and is currently estimated at $519,991, approximately $162 per square foot. 4542 Enramada Dr Unit 1358 is a home located in Tuolumne County.
Ownership History
Date
Name
Owned For
Owner Type
Purchase Details
Closed on
May 18, 2018
Sold by
Guchek Olga
Bought by
Paschenko Valeryly V
Current Estimated Value
Home Financials for this Owner
Home Financials are based on the most recent Mortgage that was taken out on this home.
Original Mortgage
$359,200
Outstanding Balance
$309,283
Interest Rate
4.4%
Mortgage Type
New Conventional
Estimated Equity
$210,708
Purchase Details
Closed on
May 16, 2018
Sold by
Coble Derral D
Bought by
Pashcenko Valerly V
Home Financials for this Owner
Home Financials are based on the most recent Mortgage that was taken out on this home.
Original Mortgage
$359,200
Outstanding Balance
$309,283
Interest Rate
4.4%
Mortgage Type
New Conventional
Estimated Equity
$210,708
Purchase Details
Closed on
May 2, 2012
Sold by
Russell Forrest M and Russell Helen L
Bought by
Coble Derral D and Coble Rebecca L
Create a Home Valuation Report for This Property
The Home Valuation Report is an in-depth analysis detailing your home's value as well as a comparison with similar homes in the area
Home Values in the Area
Average Home Value in this Area
Purchase History
| Date | Buyer | Sale Price | Title Company |
|---|---|---|---|
| Paschenko Valeryly V | -- | Fidelity National Title Co | |
| Pashcenko Valerly V | $449,000 | Fidelity National Title Co | |
| Coble Derral D | $160,000 | Yosemite Title Company |
Source: Public Records
Mortgage History
| Date | Status | Borrower | Loan Amount |
|---|---|---|---|
| Open | Pashcenko Valerly V | $359,200 |
Source: Public Records
Tax History Compared to Growth
Tax History
| Year | Tax Paid | Tax Assessment Tax Assessment Total Assessment is a certain percentage of the fair market value that is determined by local assessors to be the total taxable value of land and additions on the property. | Land | Improvement |
|---|---|---|---|---|
| 2025 | $5,492 | $510,879 | $91,023 | $419,856 |
| 2024 | $5,492 | $500,863 | $89,239 | $411,624 |
| 2023 | $5,371 | $491,043 | $87,490 | $403,553 |
| 2022 | $5,266 | $481,416 | $85,775 | $395,641 |
| 2021 | $5,189 | $471,978 | $84,094 | $387,884 |
| 2020 | $5,105 | $467,139 | $83,232 | $383,907 |
| 2019 | $4,947 | $457,980 | $81,600 | $376,380 |
| 2018 | $1,826 | $176,620 | $33,115 | $143,505 |
| 2017 | $1,800 | $173,158 | $32,466 | $140,692 |
| 2016 | $1,752 | $169,764 | $31,830 | $137,934 |
| 2015 | $1,729 | $167,215 | $31,352 | $135,863 |
| 2014 | $1,687 | $163,940 | $30,738 | $133,202 |
Source: Public Records
Map
Nearby Homes
- 4577 Madreselva St
- 13695 Barro Ct
- 13651 Barro Ct
- 0 Arbolada Dr Unit 224065324
- 0 Arbolada Dr Unit 41114682
- 10324 Gusanillo Way
- 0 Hoyito Cir
- 10090 Arbolada Dr
- 00000 Arbolada Dr
- 3357 Maravilla Dr
- 10502 Enramada Dr
- 837 Castillo Way
- 0 Salinas St Unit 225032962
- 3196 Granite Springs Rd
- 3601 Ladera Way
- 3261 Granite Springs Rd
- 0 Castillo Way Unit 225043107
- 0 Castillo Way Unit 225125624
- 14000 Cadena Way
- 10427 Violeta Way
- 4542 Enramada Dr Unit 3T
- 4542 Enramada Dr
- 4590 Enramada Dr
- 3664 Granite Springs Rd
- 3654 Granite Springs Rd
- 3664 Granite Springs Rd
- 4620 Enramada Dr
- 2859 Granite Springs Rd
- 4423 Madreselva St
- 4475 Madreselva St
- 4648 Enramada Dr
- 4525 Madreselva St
- 4557 Madreselva St
- 3444 California 132
- 2844 Granite Springs Rd
- 2944 Granite Springs Rd
- 1177 Enramada Dr
- 1205 Enramada Dr
- 1211 Enramada Dr
- 1218 Enramada Dr