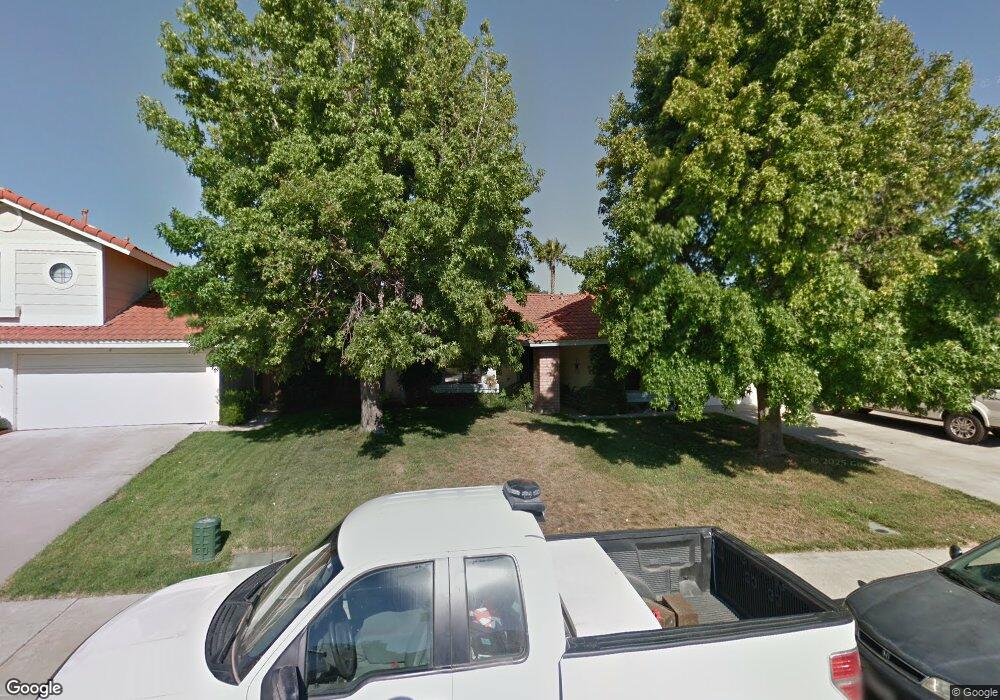
45438 Tournament Ln Temecula, CA 92592
Estimated Value: $629,445 - $672,000
3
Beds
2
Baths
1,604
Sq Ft
$409/Sq Ft
Est. Value
About This Home
This home is located at 45438 Tournament Ln, Temecula, CA 92592 and is currently estimated at $655,861, approximately $408 per square foot. 45438 Tournament Ln is a home located in Riverside County with nearby schools including Temecula Luiseno Elementary, Erle Stanley Gardner Middle School, and Great Oak High School.
Ownership History
Date
Name
Owned For
Owner Type
Purchase Details
Closed on
Nov 10, 2020
Sold by
Liscombe Timothy P and Liscombe Darla S
Bought by
Liscombe Timothy P and Liscombe Darla S
Current Estimated Value
Purchase Details
Closed on
Oct 30, 2002
Sold by
Liscombe Darla S and Leon Darla S
Bought by
Liscombe Timothy P and Liscombe Darla S
Home Financials for this Owner
Home Financials are based on the most recent Mortgage that was taken out on this home.
Original Mortgage
$162,000
Outstanding Balance
$67,505
Interest Rate
5.95%
Estimated Equity
$588,356
Purchase Details
Closed on
Sep 12, 2000
Sold by
Brown Thomas L
Bought by
Leon Darla S
Home Financials for this Owner
Home Financials are based on the most recent Mortgage that was taken out on this home.
Original Mortgage
$129,600
Interest Rate
7.96%
Purchase Details
Closed on
Apr 9, 1996
Sold by
Leon Kevin A and Leon Darla S
Bought by
Brown Thomas L
Create a Home Valuation Report for This Property
The Home Valuation Report is an in-depth analysis detailing your home's value as well as a comparison with similar homes in the area
Purchase History
| Date | Buyer | Sale Price | Title Company |
|---|---|---|---|
| Liscombe Timothy P | -- | None Available | |
| Liscombe Timothy P | -- | First American Title Co | |
| Leon Darla S | $162,000 | First American Title Ins Co | |
| Brown Thomas L | -- | -- |
Source: Public Records
Mortgage History
| Date | Status | Borrower | Loan Amount |
|---|---|---|---|
| Open | Liscombe Timothy P | $162,000 | |
| Closed | Leon Darla S | $129,600 |
Source: Public Records
Tax History
| Year | Tax Paid | Tax Assessment Tax Assessment Total Assessment is a certain percentage of the fair market value that is determined by local assessors to be the total taxable value of land and additions on the property. | Land | Improvement |
|---|---|---|---|---|
| 2025 | $3,074 | $244,078 | $67,792 | $176,286 |
| 2023 | $3,074 | $234,602 | $65,160 | $169,442 |
| 2022 | $2,969 | $230,003 | $63,883 | $166,120 |
| 2021 | $2,900 | $225,494 | $62,631 | $162,863 |
| 2020 | $2,866 | $223,183 | $61,989 | $161,194 |
| 2019 | $2,821 | $218,808 | $60,774 | $158,034 |
| 2018 | $2,760 | $214,519 | $59,584 | $154,935 |
| 2017 | $2,708 | $210,314 | $58,416 | $151,898 |
| 2016 | $2,656 | $206,191 | $57,271 | $148,920 |
| 2015 | $2,606 | $203,095 | $56,411 | $146,684 |
| 2014 | $2,524 | $199,118 | $55,307 | $143,811 |
Source: Public Records
Map
Nearby Homes
- 45610 Masters Dr
- 30752 Canterfield Dr
- 44921 Muirfield Dr
- 30574 Greenway Cir
- 30932 Greensboro Dr
- 45187 Via Vela
- 31564 Calle Canto
- 45763 Via Nubes
- 45356 Via Nubes
- 44891 Athel Way
- 45303 Esmerado Ct
- 44921 Bellflower Ln Unit 111
- 44939 Bellflower Ln Unit 118
- 31271 Taylor Ln
- 30230 De Portola Rd
- 31293 Taylor Ln
- 31409 Taylor Ln
- 45590 Alpine Place
- 31218 Comotilo Ct
- 44774 Adam Ln
- 45448 Tournament Ln
- 45426 Tournament Ln
- 45416 Tournament Ln
- 45460 Tournament Ln
- 45437 Tournament Ln
- 45470 Tournament Ln
- 45427 Tournament Ln
- 45445 Tournament Ln
- 45404 Tournament Ln
- 45385 Tournament Ln
- 45455 Tournament Ln
- 45467 Tournament Ln
- 45482 Tournament Ln
- 45457 Masters Dr
- 45394 Tournament Ln
- 45425 Masters Dr
- 45411 Masters Dr
- 45439 Masters Dr
- 45365 Tournament Ln
- 45477 Tournament Ln
Your Personal Tour Guide
Ask me questions while you tour the home.