4544 Val St Fremont, CA 94538
Sundale NeighborhoodEstimated Value: $1,356,000 - $1,551,000
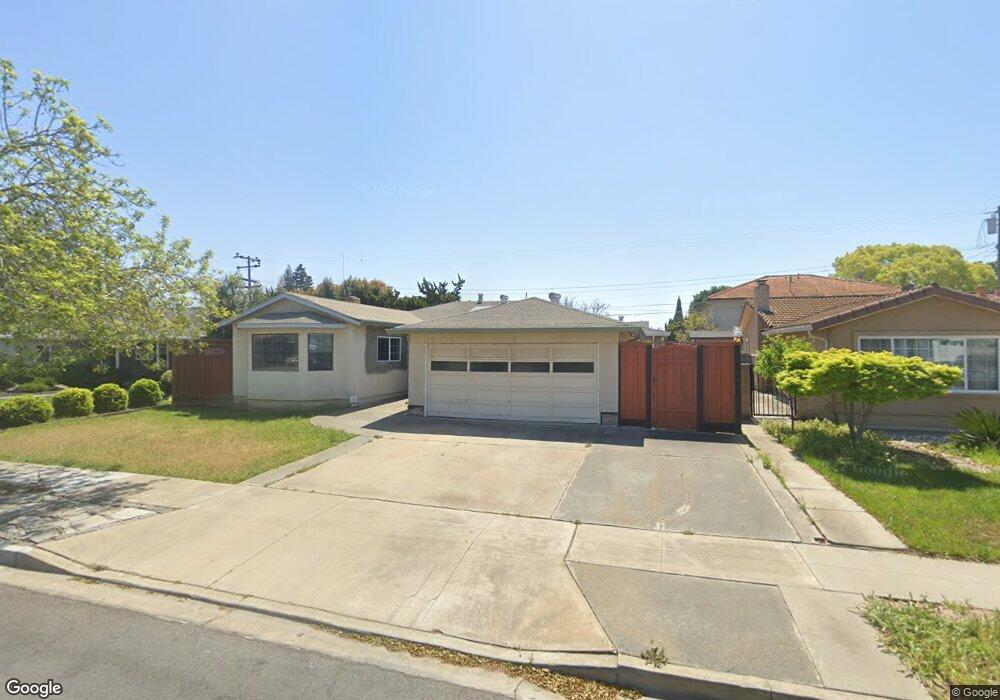
About This Home
This home is located at 4544 Val St, Fremont, CA 94538 and is currently estimated at $1,464,142, approximately $965 per square foot. 4544 Val St is a home located in Alameda County with nearby schools including John Blacow Elementary School, G.M. Walters Middle School, and John F. Kennedy High School.
Ownership History
We collect this data history from publicly available records. To have your information removed, we recommend requesting removal directly through your county’s website.
Purchase Details
Home Financials for this Owner
Home Financials are based on the most recent Mortgage that was taken out on this home.Home Values in the Area
Average Home Value in this Area
Purchase History
We collect this data history from publicly available records. To have your information removed, we recommend requesting removal directly through your county’s website.
| Date | Buyer | Sale Price | Title Company |
|---|---|---|---|
| $580,000 | Alliance Title Company |
Mortgage History
We collect this data history from publicly available records. To have your information removed, we recommend requesting removal directly through your county’s website.
| Date | Status | Borrower | Loan Amount |
|---|---|---|---|
| Open | $464,000 |
Tax History
We collect this data history from publicly available records. To have your information removed, we recommend requesting removal directly through your county’s website.
| Year | Tax Paid | Tax Assessment Tax Assessment Total Assessment is a certain percentage of the fair market value that is determined by local assessors to be the total taxable value of land and additions on the property. | Land | Improvement |
|---|---|---|---|---|
| 2025 | $9,966 | $823,556 | $242,517 | $588,039 |
| 2024 | $9,966 | $807,277 | $237,764 | $576,513 |
| 2023 | $9,698 | $798,312 | $233,102 | $565,210 |
| 2022 | $9,571 | $775,664 | $228,533 | $554,131 |
| 2021 | $9,335 | $760,319 | $224,052 | $543,267 |
| 2020 | $9,359 | $759,454 | $221,756 | $537,698 |
| 2019 | $9,252 | $744,567 | $217,409 | $527,158 |
| 2018 | $9,070 | $729,974 | $213,148 | $516,826 |
| 2017 | $8,843 | $715,666 | $208,970 | $506,696 |
| 2016 | $8,692 | $701,638 | $204,874 | $496,764 |
| 2015 | $7,905 | $634,000 | $190,200 | $443,800 |
| 2014 | $7,784 | $623,000 | $186,900 | $436,100 |
Map
- 40335 Robin St
- 40152 Margery Ct
- 4685 Piper St
- 4683 De Silva St
- 4454 Cahill St
- 4763 Piper St
- 4498 Ladner St
- 4380 Ladner St
- 4612 Drury Ct
- 40772 Blacow Rd
- 5040 Brian Ct
- 4463 Hyde Common Unit 306
- 4463 Hyde Common Unit 116
- 4244 Providence Terrace
- 4451 Westerly Common Unit 57
- 4310 Providence Terrace
- 41328 Thurston St
- 4254 Tehama Ave
- 40884 Blacow Rd
- 4265 Tehama Ave
Ask me questions while you tour the home.