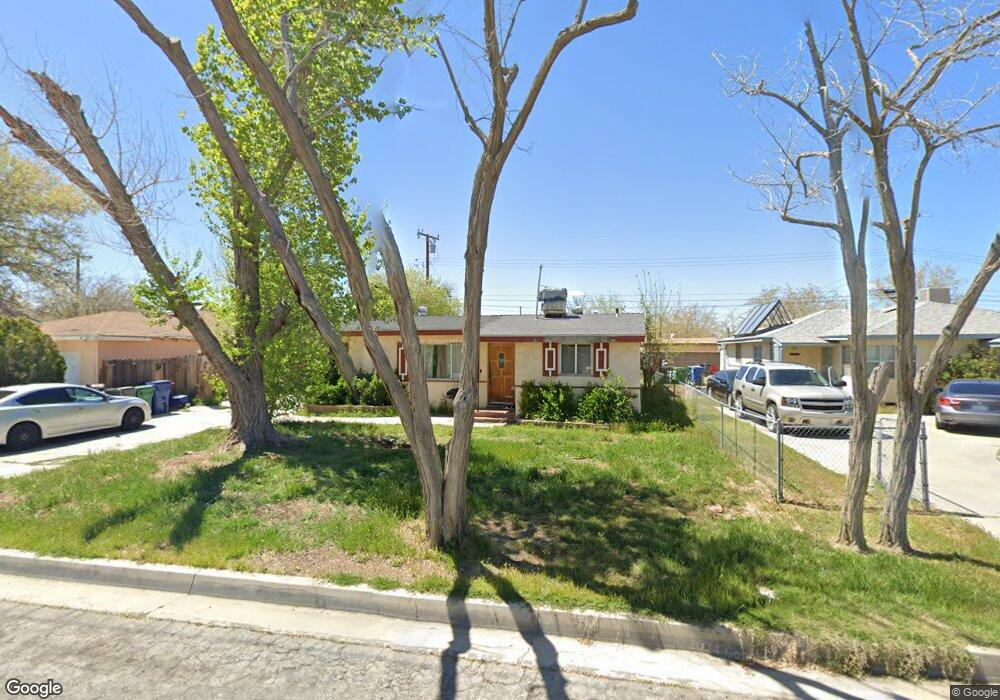
45449 12th St W Lancaster, CA 93534
Central Lancaster NeighborhoodEstimated Value: $353,000 - $373,000
3
Beds
1
Bath
1,073
Sq Ft
$339/Sq Ft
Est. Value
About This Home
This home is located at 45449 12th St W, Lancaster, CA 93534 and is currently estimated at $363,811, approximately $339 per square foot. 45449 12th St W is a home located in Los Angeles County with nearby schools including Desert View Elementary School, Piute Middle School, and Antelope Valley High School.
Ownership History
Date
Name
Owned For
Owner Type
Purchase Details
Closed on
Dec 16, 2021
Sold by
King Stacey A
Bought by
Brown Ebony Chanene
Current Estimated Value
Purchase Details
Closed on
Jul 3, 1997
Sold by
Hud
Bought by
King Stacy and Alexander Michico
Home Financials for this Owner
Home Financials are based on the most recent Mortgage that was taken out on this home.
Original Mortgage
$50,102
Interest Rate
7.92%
Mortgage Type
FHA
Purchase Details
Closed on
Mar 27, 1997
Sold by
Norwest Mtg Inc
Bought by
Hud
Purchase Details
Closed on
Dec 17, 1996
Sold by
Perez Jesus R
Bought by
Norwest Mtg Inc
Purchase Details
Closed on
Jan 12, 1995
Sold by
Hud
Bought by
Perez Jesus Ray
Home Financials for this Owner
Home Financials are based on the most recent Mortgage that was taken out on this home.
Original Mortgage
$71,053
Interest Rate
9.16%
Mortgage Type
FHA
Purchase Details
Closed on
Sep 30, 1994
Sold by
Bancboston Mtg Corp
Bought by
Hud
Purchase Details
Closed on
Sep 9, 1994
Sold by
Walker Douglas Bryan
Bought by
Bancboston Mtg Corp
Create a Home Valuation Report for This Property
The Home Valuation Report is an in-depth analysis detailing your home's value as well as a comparison with similar homes in the area
Home Values in the Area
Average Home Value in this Area
Purchase History
| Date | Buyer | Sale Price | Title Company |
|---|---|---|---|
| Brown Ebony Chanene | -- | None Listed On Document | |
| King Stacy | $50,000 | First American Title Co | |
| Hud | -- | First American Title Ins Co | |
| Norwest Mtg Inc | $77,150 | First American Title Ins Co | |
| Perez Jesus Ray | $70,000 | World Title | |
| Hud | -- | First Southwestern Title | |
| Bancboston Mtg Corp | $100,155 | First Southwestern Title |
Source: Public Records
Mortgage History
| Date | Status | Borrower | Loan Amount |
|---|---|---|---|
| Previous Owner | King Stacy | $50,102 | |
| Previous Owner | Perez Jesus Ray | $71,053 |
Source: Public Records
Tax History Compared to Growth
Tax History
| Year | Tax Paid | Tax Assessment Tax Assessment Total Assessment is a certain percentage of the fair market value that is determined by local assessors to be the total taxable value of land and additions on the property. | Land | Improvement |
|---|---|---|---|---|
| 2025 | $3,971 | $221,751 | $57,812 | $163,939 |
| 2024 | $3,971 | $217,404 | $56,679 | $160,725 |
| 2023 | $3,888 | $213,142 | $55,568 | $157,574 |
| 2022 | $2,266 | $90,253 | $27,070 | $63,183 |
| 2021 | $1,895 | $88,485 | $26,540 | $61,945 |
| 2019 | $1,850 | $85,861 | $25,753 | $60,108 |
| 2018 | $1,820 | $84,179 | $25,249 | $58,930 |
| 2016 | $1,736 | $80,912 | $24,269 | $56,643 |
| 2015 | $1,719 | $79,698 | $23,905 | $55,793 |
| 2014 | $1,729 | $78,138 | $23,437 | $54,701 |
Source: Public Records
Map
Nearby Homes
- 45546 12th St W
- 45505 13th St W
- 45521 13
- 1209 W Avenue h8
- 45417 11th St W
- 1029 W Avenue h8
- 32 St W Avenue H 8
- 32 W Avenue H 8
- 1720 W Avenue H 7
- 45446 10th St W
- 1217 W Avenue h7
- 1126 W Avenue h6
- 1046 W Avenue H-6
- 1475 Boyden Ave
- 1258 W Avenue h6
- 821 W Holguin St
- 1328 W Avenue H-6
- 727 W Avenue H 8
- 1029 W Avenue h5
- 1408 W Avenue h15
- 45455 12th St W
- 45443 12th St W
- 45448 Newtree Ave
- 45437 12th St W
- 45461 12th St W
- 45442 Newtree Ave
- 45454 Newtree Ave
- 45436 Newtree Ave
- 45448 12th St W
- 45460 Newtree Ave
- 45454 12th St W
- 45442 12th St W
- 45503 12th St W
- 45460 12th St W
- 1219 W Avenue h11
- 45502 Newtree Ave
- 45502 12th St W
- 1149 W Avenue h11
- 45511 12th St W
- 45451 Kingtree Ave