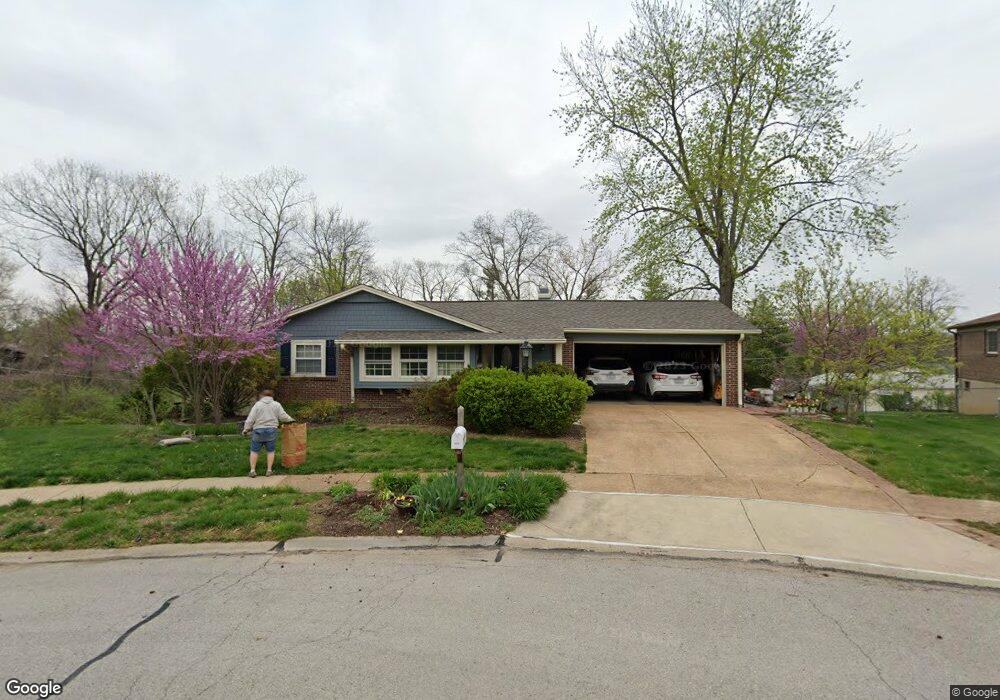
4545 Braungate Dr Saint Louis, MO 63128
Estimated Value: $289,607 - $340,000
3
Beds
3
Baths
1,361
Sq Ft
$227/Sq Ft
Est. Value
About This Home
This home is located at 4545 Braungate Dr, Saint Louis, MO 63128 and is currently estimated at $309,402, approximately $227 per square foot. 4545 Braungate Dr is a home located in St. Louis County with nearby schools including Trautwein Elementary School, Washington Middle School, and Mehlville High School.
Ownership History
Date
Name
Owned For
Owner Type
Purchase Details
Closed on
Aug 5, 2025
Sold by
Hoffschwelle Stephanie J
Bought by
Stephanie J Hoffschwelle and Stephanie J Hoffschwelle Revocable Trust
Current Estimated Value
Purchase Details
Closed on
Aug 9, 2011
Sold by
Hoffschwelle Douglas A
Bought by
Hoffschwelle Stephanie J
Purchase Details
Closed on
Aug 31, 2000
Sold by
Hoffschwelle Richard H and Hoffschwelle Stephanie J
Bought by
Hoffschwelle Richard H and Richard Hoffschwelle Living Trust
Purchase Details
Closed on
Nov 17, 1999
Sold by
Wallis Robert J and Wallis Elizabeth A
Bought by
Hoffschwelle Richard H and Hoffschwelle Stephanie J
Home Financials for this Owner
Home Financials are based on the most recent Mortgage that was taken out on this home.
Original Mortgage
$114,400
Interest Rate
7.83%
Create a Home Valuation Report for This Property
The Home Valuation Report is an in-depth analysis detailing your home's value as well as a comparison with similar homes in the area
Home Values in the Area
Average Home Value in this Area
Purchase History
| Date | Buyer | Sale Price | Title Company |
|---|---|---|---|
| Stephanie J Hoffschwelle | -- | None Listed On Document | |
| Hoffschwelle Stephanie J | -- | None Available | |
| Hoffschwelle Richard H | -- | -- | |
| Hoffschwelle Richard H | $143,000 | -- |
Source: Public Records
Mortgage History
| Date | Status | Borrower | Loan Amount |
|---|---|---|---|
| Previous Owner | Hoffschwelle Richard H | $114,400 |
Source: Public Records
Tax History Compared to Growth
Tax History
| Year | Tax Paid | Tax Assessment Tax Assessment Total Assessment is a certain percentage of the fair market value that is determined by local assessors to be the total taxable value of land and additions on the property. | Land | Improvement |
|---|---|---|---|---|
| 2025 | $2,714 | $44,100 | $17,250 | $26,850 |
| 2024 | $2,714 | $40,280 | $13,410 | $26,870 |
| 2023 | $2,679 | $40,280 | $13,410 | $26,870 |
| 2022 | $2,753 | $41,630 | $13,410 | $28,220 |
| 2021 | $2,665 | $41,630 | $13,410 | $28,220 |
| 2020 | $2,319 | $34,410 | $11,460 | $22,950 |
| 2019 | $2,312 | $34,410 | $11,460 | $22,950 |
| 2018 | $2,245 | $30,160 | $9,560 | $20,600 |
| 2017 | $2,244 | $30,180 | $9,560 | $20,620 |
| 2016 | $2,352 | $30,380 | $9,560 | $20,820 |
| 2015 | $2,160 | $30,380 | $9,560 | $20,820 |
| 2014 | $2,501 | $34,880 | $7,730 | $27,150 |
Source: Public Records
Map
Nearby Homes
- 4921 Kerth Rd
- 4508 Frederickton Ct
- 5134 Butler Hill Ct
- 5161 Butler Bend Dr
- 5251 Tuscan Chase Ct
- 4540 Butler Hill Rd
- 5057 Peyton Place Ct
- 5102 Peyton Place Ct
- 4942 Caribee Dr
- 4833 Hursley Dr
- 4839 Hursley Dr
- 4724 Tarlton Dr
- 4643 Littlebury Dr
- 5417 Morningdale Place
- 4818 Chapel Hill Dr
- 5317 Hamlin Ct
- 4374 Bristol View Ct
- 4525 Eli Dr Unit D
- 5263 Faro Dr
- 4642 Theiss Rd
- 4543 Braungate Dr
- 4551 Braungate Dr
- 4552 Towne Centre Dr
- 4537 Braungate Dr
- 4542 Braungate Dr
- 4557 Braungate Dr
- 4568 Towne Centre Dr
- 4544 Towne Centre Dr
- 4536 Braungate Dr
- 4917 Waringford Dr
- 4574 Towne Centre Dr
- 4563 Braungate Dr
- 4920 Crownover Dr
- 4945 Waringford Dr
- 4907 Waringford Dr
- 4916 Crownover Dr
- 4925 Waringford Dr
- 4565 Towne Centre Dr
- 4931 Waringford Dr
- 4547 Towne Centre Dr