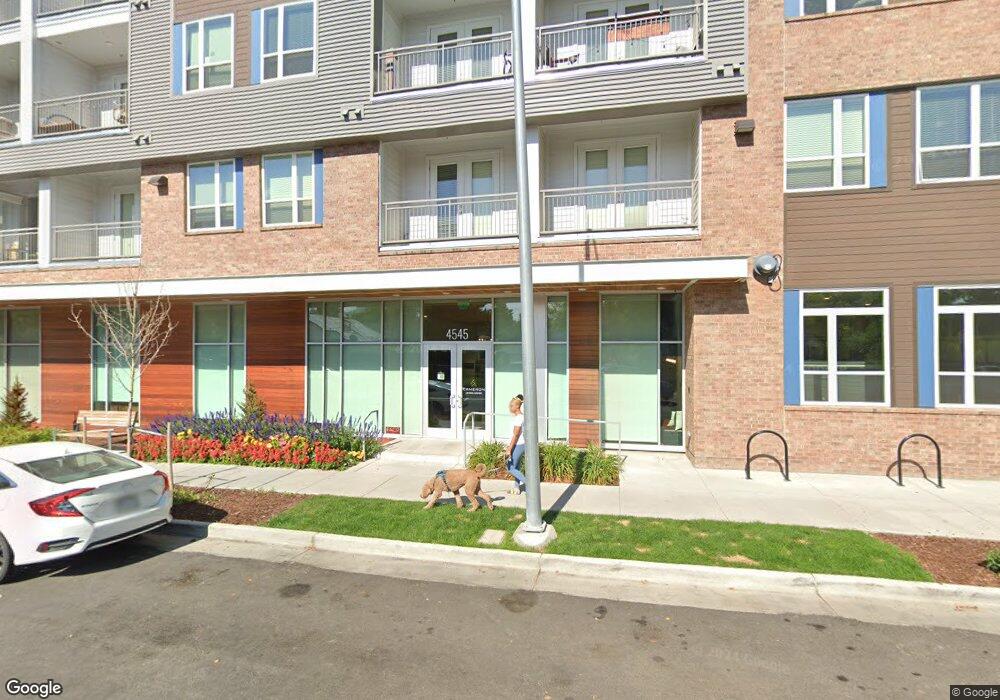
4545 E Warren Ave Denver, CO 80222
University Hills Neighborhood
2
Beds
--
Bath
1,503
Sq Ft
--
Built
About This Home
Where Comfortable Meets Close Welcome to Denver’s new home for balanced living. A place where work and urban excitement are close, and laid-back neighborhood relaxation is even closer. The Cameron’s modern design, vibrant surroundings, and location midway between downtown and the Tech Center combine to create the perfect environment for an enjoyable and rewarding life. An environment where you can enjoy a truly live-work-play lifestyle supported by an unmatched blend of comfort, style, and convenience.
Create a Home Valuation Report for This Property
The Home Valuation Report is an in-depth analysis detailing your home's value as well as a comparison with similar homes in the area
Home Values in the Area
Average Home Value in this Area
Property History
| Date | Event | Price | List to Sale | Price per Sq Ft |
|---|---|---|---|---|
| 10/04/2025 10/04/25 | Off Market | $1,410 | -- | -- |
| 09/26/2025 09/26/25 | Price Changed | $1,410 | -16.8% | $3 / Sq Ft |
| 08/19/2025 08/19/25 | Price Changed | $1,695 | +19.5% | $3 / Sq Ft |
| 07/25/2025 07/25/25 | Price Changed | $1,418 | -0.4% | $3 / Sq Ft |
| 07/10/2025 07/10/25 | Price Changed | $1,423 | -1.7% | $3 / Sq Ft |
| 05/08/2025 05/08/25 | Price Changed | $1,448 | -2.0% | $3 / Sq Ft |
| 03/24/2025 03/24/25 | Price Changed | $1,478 | +0.7% | $3 / Sq Ft |
| 02/12/2025 02/12/25 | Price Changed | $1,468 | -1.0% | $3 / Sq Ft |
| 02/02/2025 02/02/25 | Price Changed | $1,483 | +4.0% | $3 / Sq Ft |
| 01/24/2025 01/24/25 | Price Changed | $1,426 | -3.8% | $3 / Sq Ft |
| 09/25/2024 09/25/24 | Price Changed | $1,483 | -2.6% | $3 / Sq Ft |
| 09/17/2024 09/17/24 | Price Changed | $1,523 | +2.7% | $3 / Sq Ft |
| 09/14/2024 09/14/24 | Price Changed | $1,483 | +6.1% | $3 / Sq Ft |
| 09/12/2024 09/12/24 | Price Changed | $1,398 | -5.7% | $3 / Sq Ft |
| 09/10/2024 09/10/24 | Price Changed | $1,483 | -3.3% | $3 / Sq Ft |
| 08/10/2024 08/10/24 | Price Changed | $1,533 | +7.5% | $3 / Sq Ft |
| 08/10/2024 08/10/24 | Price Changed | $1,426 | -7.0% | $3 / Sq Ft |
| 07/26/2024 07/26/24 | Price Changed | $1,533 | +7.5% | $3 / Sq Ft |
| 07/24/2024 07/24/24 | Price Changed | $1,426 | +3.1% | $3 / Sq Ft |
| 07/19/2024 07/19/24 | Price Changed | $1,383 | -3.0% | $3 / Sq Ft |
| 07/02/2024 07/02/24 | Price Changed | $1,426 | -7.0% | $3 / Sq Ft |
| 03/07/2024 03/07/24 | Price Changed | $1,533 | -0.8% | $3 / Sq Ft |
| 02/24/2024 02/24/24 | Price Changed | $1,546 | -2.5% | $3 / Sq Ft |
| 02/02/2024 02/02/24 | Price Changed | $1,586 | +0.8% | $3 / Sq Ft |
| 09/20/2023 09/20/23 | Price Changed | $1,573 | -5.2% | $3 / Sq Ft |
| 08/22/2023 08/22/23 | Price Changed | $1,659 | +0.6% | $3 / Sq Ft |
| 08/07/2023 08/07/23 | For Rent | $1,649 | 0.0% | -- |
| 07/16/2023 07/16/23 | Price Changed | $1,649 | +4.4% | $3 / Sq Ft |
| 07/12/2023 07/12/23 | Price Changed | $1,579 | 0.0% | $3 / Sq Ft |
| 07/12/2023 07/12/23 | For Rent | $1,579 | -4.2% | -- |
| 06/21/2023 06/21/23 | Price Changed | $1,649 | +10.0% | $3 / Sq Ft |
| 06/21/2023 06/21/23 | Price Changed | $1,499 | -6.3% | $3 / Sq Ft |
| 06/14/2023 06/14/23 | Price Changed | $1,599 | 0.0% | $3 / Sq Ft |
| 06/14/2023 06/14/23 | For Rent | $1,599 | +6.7% | -- |
| 05/26/2023 05/26/23 | Price Changed | $1,499 | -2.8% | $3 / Sq Ft |
| 02/17/2023 02/17/23 | Price Changed | $1,542 | +210.9% | $3 / Sq Ft |
| 02/16/2023 02/16/23 | Price Changed | $496 | -67.8% | $1 / Sq Ft |
| 01/13/2023 01/13/23 | Price Changed | $1,542 | -1.6% | $3 / Sq Ft |
| 01/05/2023 01/05/23 | Price Changed | $1,567 | +1.6% | $3 / Sq Ft |
| 11/22/2022 11/22/22 | For Rent | $1,542 | -- | -- |
Tax History
| Year | Tax Paid | Tax Assessment Tax Assessment Total Assessment is a certain percentage of the fair market value that is determined by local assessors to be the total taxable value of land and additions on the property. | Land | Improvement |
|---|---|---|---|---|
| 2025 | $852,560 | $8,525,920 | $1,053,300 | $1,053,300 |
| 2024 | $852,560 | $10,764,370 | $997,320 | $9,767,050 |
| 2023 | $576,084 | $7,434,680 | $997,320 | $6,437,360 |
| 2022 | $277,054 | $3,483,860 | $1,015,950 | $2,467,910 |
| 2021 | $147,552 | $1,977,430 | $1,068,240 | $909,190 |
Source: Public Records
Map
Nearby Homes
- 2217 S Cherry St
- 2190 S Birch St
- 2180 S Birch St
- 2178 S Bellaire St
- 4675 E Iliff Ave
- 4265 E Iliff Ave Unit 2
- 4600 E Asbury Cir Unit 104
- 4600 E Asbury Cir Unit 110
- 4600 E Asbury Cir Unit 411
- 4205 E Iliff Ave Unit 1
- 4205 E Iliff Ave Unit 5
- 3362 S Albion St
- 1971 S Dahlia St
- 4901 E Asbury Ave
- 2133-2141 S Ash St
- 4701 E Jewell Ave
- 4224 E Dickenson Place
- 3875 E Wesley Ave
- 2510 S Cherry St
- 1860 S Dahlia St
- 4545 E Warren Ave Unit 466
- 4501 E Warren Ave
- 2200 S Clermont St
- 2201 S Cherry St
- 2176 S Clermont St
- 2208 S Clermont St
- 2172 S Clermont St
- 2209 S Cherry St
- 2216 S Clermont St
- 2195 S Clermont St
- 2193 S Clermont St
- 2205 S Clermont St
- 2187 S Clermont St
- 2197 S Clermont St
- 2177 S Clermont St
- 2185 S Clermont St
- 4467 E Warren Ave
- 4465 E Warren Ave
- 2225 S Cherry St
- 2226 S Clermont St
Your Personal Tour Guide
Ask me questions while you tour the home.