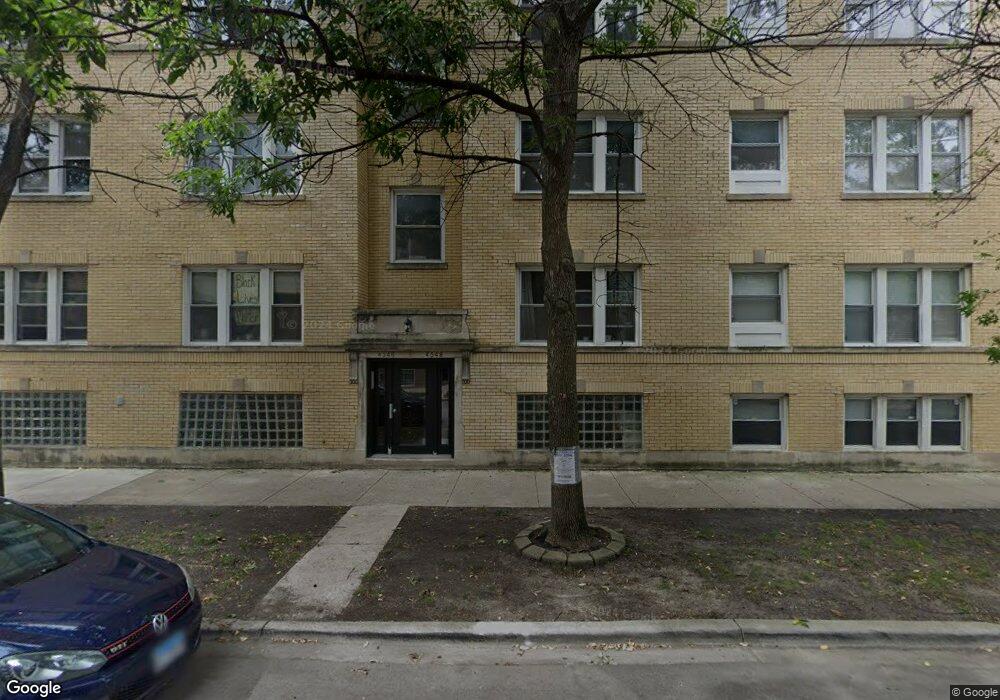
4546 N Albany Ave Unit 45461 Chicago, IL 60625
Albany Park NeighborhoodEstimated Value: $245,122 - $302,000
2
Beds
1
Bath
24,600
Sq Ft
$11/Sq Ft
Est. Value
About This Home
This home is located at 4546 N Albany Ave Unit 45461, Chicago, IL 60625 and is currently estimated at $274,531, approximately $11 per square foot. 4546 N Albany Ave Unit 45461 is a home located in Cook County with nearby schools including Bateman Elementary School, Roosevelt High School, and ASPIRA Haugan Middle School.
Ownership History
Date
Name
Owned For
Owner Type
Purchase Details
Closed on
Jul 29, 2016
Sold by
Starzynski Mary Kay
Bought by
Frische Sarah and Frische John
Current Estimated Value
Home Financials for this Owner
Home Financials are based on the most recent Mortgage that was taken out on this home.
Original Mortgage
$174,400
Outstanding Balance
$141,396
Interest Rate
3.99%
Mortgage Type
New Conventional
Estimated Equity
$133,135
Purchase Details
Closed on
Sep 26, 2003
Sold by
Kolios Emily Linda
Bought by
Starzynski Mary Kay
Home Financials for this Owner
Home Financials are based on the most recent Mortgage that was taken out on this home.
Original Mortgage
$18,300
Interest Rate
5.91%
Mortgage Type
Unknown
Purchase Details
Closed on
Jan 25, 2002
Sold by
Wilson Manor Ltd
Bought by
Kolios Emily Linda
Home Financials for this Owner
Home Financials are based on the most recent Mortgage that was taken out on this home.
Original Mortgage
$141,550
Interest Rate
6.95%
Create a Home Valuation Report for This Property
The Home Valuation Report is an in-depth analysis detailing your home's value as well as a comparison with similar homes in the area
Home Values in the Area
Average Home Value in this Area
Purchase History
| Date | Buyer | Sale Price | Title Company |
|---|---|---|---|
| Frische Sarah | $184,000 | Stewart Title | |
| Starzynski Mary Kay | $183,000 | Cti | |
| Kolios Emily Linda | $149,000 | -- |
Source: Public Records
Mortgage History
| Date | Status | Borrower | Loan Amount |
|---|---|---|---|
| Open | Frische Sarah | $174,400 | |
| Previous Owner | Starzynski Mary Kay | $18,300 | |
| Previous Owner | Kolios Emily Linda | $141,550 |
Source: Public Records
Tax History Compared to Growth
Tax History
| Year | Tax Paid | Tax Assessment Tax Assessment Total Assessment is a certain percentage of the fair market value that is determined by local assessors to be the total taxable value of land and additions on the property. | Land | Improvement |
|---|---|---|---|---|
| 2024 | $2,897 | $20,342 | $1,341 | $19,001 |
| 2023 | $2,803 | $17,000 | $1,073 | $15,927 |
| 2022 | $2,803 | $17,000 | $1,073 | $15,927 |
| 2021 | $2,758 | $16,999 | $1,072 | $15,927 |
| 2020 | $3,131 | $14,006 | $555 | $13,451 |
| 2019 | $3,164 | $15,696 | $555 | $15,141 |
| 2018 | $3,111 | $15,696 | $555 | $15,141 |
| 2017 | $2,740 | $12,686 | $498 | $12,188 |
| 2016 | $2,048 | $12,686 | $498 | $12,188 |
| 2015 | $1,850 | $12,686 | $498 | $12,188 |
| 2014 | $2,105 | $13,874 | $459 | $13,415 |
| 2013 | $2,053 | $13,874 | $459 | $13,415 |
Source: Public Records
Map
Nearby Homes
- 3055 W Sunnyside Ave Unit 1
- 3135 W Leland Ave Unit 3W
- 4437 N Whipple St
- 4438 N Kedzie Ave Unit G-1
- 4709 N Sacramento Ave
- 4425 N Sacramento Ave
- 4750 N Albany Ave Unit 2
- 4750 N Albany Ave Unit 3
- 4411 N Sacramento Ave Unit 1
- 3113 W Lawrence Ave Unit A301
- 4752 N Albany Ave Unit 3
- 2901 W Sunnyside Ave
- 4333 N Troy St Unit 3E
- 4438 N Spaulding Ave
- 4343 N Sacramento Ave Unit 2B
- 4343 N Sacramento Ave Unit A-G
- 4714 N Spaulding Ave
- 3000 W Lawrence Ave Unit 3H
- 4307 N Troy St Unit 1
- 4347 N Richmond St Unit 2N
- 4546 N Albany Ave Unit 45463
- 4546 N Albany Ave Unit 45462
- 4546 N Albany Ave Unit 1
- 3103 W Wilson Ave Unit 2
- 3103 W Wilson Ave Unit 1
- 3103 W Wilson Ave Unit 31033
- 3103 W Wilson Ave Unit 31032
- 3103 W Wilson Ave Unit 31031
- 4548 N Albany Ave Unit 45481
- 3103 W Wilson Ave Unit 3103G
- 3105 W Wilson Ave Unit 31053
- 3105 W Wilson Ave Unit 31051
- 4548 N Albany Ave Unit 45482
- 4548 N Albany Ave Unit 45483
- 3105 W Wilson Ave Unit 31052
- 3103 W Wilson Ave Unit L1E
- 4548 N Albany Ave Unit 2
- 4548 N Albany Ave Unit 1
- 3103 W Wilson Ave Unit 3
- 3103 W Wilson Ave Unit 1