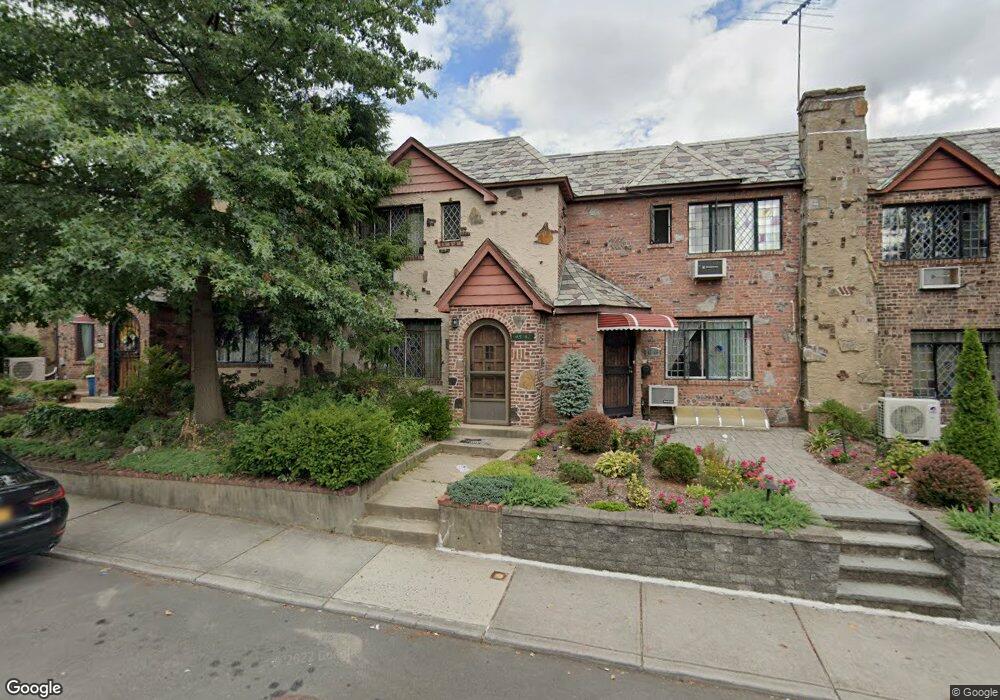
4547 193rd St Flushing, NY 11358
Auburndale NeighborhoodEstimated Value: $935,000 - $998,360
Studio
--
Bath
1,600
Sq Ft
$606/Sq Ft
Est. Value
About This Home
This home is located at 4547 193rd St, Flushing, NY 11358 and is currently estimated at $968,840, approximately $605 per square foot. 4547 193rd St is a home located in Queens County with nearby schools including P.S. 107 Thomas A Dooley, I.S. 25 Adrien Block, and Francis Lewis High School.
Ownership History
Date
Name
Owned For
Owner Type
Purchase Details
Closed on
May 12, 2025
Sold by
Ann Marie Haag Declaration Of Trust and Ann Marie Haag As Trustee
Bought by
Zhang Ming Cheng and Zheng Wen Shan
Current Estimated Value
Home Financials for this Owner
Home Financials are based on the most recent Mortgage that was taken out on this home.
Original Mortgage
$713,250
Outstanding Balance
$709,433
Interest Rate
6.64%
Mortgage Type
Purchase Money Mortgage
Estimated Equity
$259,407
Purchase Details
Closed on
Jun 18, 2022
Sold by
Haag Ann Marie
Bought by
Ann Marie Haag As Trustee and The Ann Marie Haag Declaration Of Trust
Create a Home Valuation Report for This Property
The Home Valuation Report is an in-depth analysis detailing your home's value as well as a comparison with similar homes in the area
Home Values in the Area
Average Home Value in this Area
Purchase History
| Date | Buyer | Sale Price | Title Company |
|---|---|---|---|
| Zhang Ming Cheng | $951,000 | -- | |
| Zhang Ming Cheng | $951,000 | -- | |
| Ann Marie Haag As Trustee | -- | -- | |
| Ann Marie Haag As Trustee | -- | -- |
Source: Public Records
Mortgage History
| Date | Status | Borrower | Loan Amount |
|---|---|---|---|
| Open | Zhang Ming Cheng | $713,250 | |
| Closed | Zhang Ming Cheng | $713,250 |
Source: Public Records
Tax History
| Year | Tax Paid | Tax Assessment Tax Assessment Total Assessment is a certain percentage of the fair market value that is determined by local assessors to be the total taxable value of land and additions on the property. | Land | Improvement |
|---|---|---|---|---|
| 2025 | $9,116 | $48,108 | $14,575 | $33,533 |
| 2024 | $9,116 | $45,385 | $13,186 | $32,199 |
| 2023 | $8,956 | $44,098 | $13,302 | $30,796 |
| 2022 | $3,014 | $52,560 | $16,560 | $36,000 |
| 2021 | $3,214 | $55,920 | $16,560 | $39,360 |
| 2020 | $3,076 | $54,300 | $16,560 | $37,740 |
| 2019 | $2,795 | $54,780 | $16,560 | $38,220 |
| 2018 | $2,597 | $36,748 | $11,345 | $25,403 |
| 2017 | $5,834 | $34,669 | $11,813 | $22,856 |
| 2016 | $5,725 | $34,669 | $11,813 | $22,856 |
| 2015 | $3,164 | $33,408 | $14,610 | $18,798 |
| 2014 | $3,164 | $31,518 | $15,119 | $16,399 |
Source: Public Records
Map
Nearby Homes
- 45-47 193rd St
- 4539 192nd St
- 4604 195th St
- 45-31 195th St
- 4552 196th St
- 43-44 195th St
- 43-32 194th St
- 45-66 196th Place
- 4719 192nd St
- 47-55 194th St
- 45-32 Utopia Pkwy
- 43-28 196th St
- 47-49 194th St
- 47-18 190th St
- 196-64 45th Ave
- 4756 196th St
- 19005 48th Ave
- 188-02 Northern Blvd
- 42-25 189th St
- 171-06 Bagley Ave
Your Personal Tour Guide
Ask me questions while you tour the home.