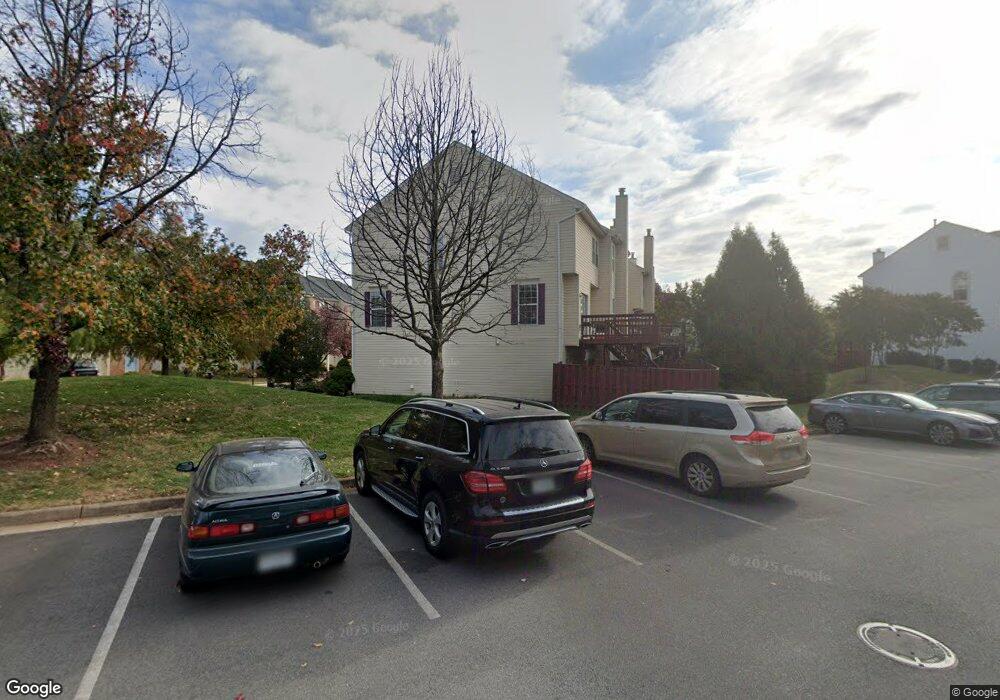
45473 Baggett Terrace Sterling, VA 20166
Estimated Value: $568,085 - $590,000
3
Beds
4
Baths
1,516
Sq Ft
$382/Sq Ft
Est. Value
About This Home
This home is located at 45473 Baggett Terrace, Sterling, VA 20166 and is currently estimated at $578,771, approximately $381 per square foot. 45473 Baggett Terrace is a home located in Loudoun County with nearby schools including Sterling Elementary School, River Bend Middle School, and Potomac Falls High School.
Ownership History
Date
Name
Owned For
Owner Type
Purchase Details
Closed on
Jun 25, 2002
Sold by
Armentrout Kevin
Bought by
Oefilippo Stacey
Current Estimated Value
Home Financials for this Owner
Home Financials are based on the most recent Mortgage that was taken out on this home.
Original Mortgage
$218,500
Outstanding Balance
$93,105
Interest Rate
6.92%
Mortgage Type
New Conventional
Estimated Equity
$485,666
Purchase Details
Closed on
Mar 29, 2001
Sold by
Small Jame C
Bought by
Armenirout Kevin P
Home Financials for this Owner
Home Financials are based on the most recent Mortgage that was taken out on this home.
Original Mortgage
$162,500
Interest Rate
6.96%
Purchase Details
Closed on
May 5, 1995
Sold by
John Laing Homes Inc
Bought by
Small James C
Home Financials for this Owner
Home Financials are based on the most recent Mortgage that was taken out on this home.
Original Mortgage
$150,750
Interest Rate
8.36%
Create a Home Valuation Report for This Property
The Home Valuation Report is an in-depth analysis detailing your home's value as well as a comparison with similar homes in the area
Home Values in the Area
Average Home Value in this Area
Purchase History
| Date | Buyer | Sale Price | Title Company |
|---|---|---|---|
| Oefilippo Stacey | $242,900 | -- | |
| Armenirout Kevin P | $162,500 | -- | |
| Small James C | $158,735 | -- |
Source: Public Records
Mortgage History
| Date | Status | Borrower | Loan Amount |
|---|---|---|---|
| Open | Oefilippo Stacey | $218,500 | |
| Previous Owner | Armenirout Kevin P | $162,500 | |
| Previous Owner | Small James C | $150,750 |
Source: Public Records
Tax History Compared to Growth
Tax History
| Year | Tax Paid | Tax Assessment Tax Assessment Total Assessment is a certain percentage of the fair market value that is determined by local assessors to be the total taxable value of land and additions on the property. | Land | Improvement |
|---|---|---|---|---|
| 2025 | $4,363 | $541,990 | $178,500 | $363,490 |
| 2024 | $4,392 | $507,780 | $178,500 | $329,280 |
| 2023 | $4,196 | $479,520 | $168,500 | $311,020 |
| 2022 | $4,160 | $467,370 | $158,500 | $308,870 |
| 2021 | $4,110 | $419,430 | $133,500 | $285,930 |
| 2020 | $4,047 | $391,010 | $118,500 | $272,510 |
| 2019 | $3,887 | $371,920 | $118,500 | $253,420 |
| 2018 | $3,926 | $361,840 | $118,500 | $243,340 |
| 2017 | $3,743 | $332,700 | $118,500 | $214,200 |
| 2016 | $3,767 | $328,970 | $0 | $0 |
| 2015 | $3,573 | $196,320 | $0 | $196,320 |
| 2014 | $3,661 | $198,430 | $0 | $198,430 |
Source: Public Records
Map
Nearby Homes
- 45439 Baggett Terrace
- 21897 Elkins Terrace
- 45495 Caboose Terrace Unit 302
- 22078 Manning Square
- 45550 Reading Terrace
- 21901 Golden Spike Terrace
- 46294 Mount Milstead Terrace Unit 400
- 46270 Mount Allen Terrace Unit 300
- 21630 Hawksbill High Cir Unit 302
- 46294 Mount Milstead Terrace Unit 303
- 46270 Mount Allen Terrace Unit 201
- 45445 Timber Trail Square
- 45481 Bluemont Junction Square
- 45458 Oak Trail Square
- 45752 Winding Branch Terrace
- 1006 S Greenthorn Ave
- 801 S Filbert Ct
- 1028A Brixton Ct
- 1044 Brixton Ct Unit B
- 1034 Salisbury Ct
- 45475 Baggett Terrace
- 45477 Baggett Terrace
- 45479 Baggett Terrace
- 45481 Baggett Terrace
- 45483 Baggett Terrace
- 45472 Baggett Terrace
- 45470 Baggett Terrace
- 45468 Baggett Terrace
- 45476 Baggett Terrace
- 45466 Baggett Terrace
- 45478 Baggett Terrace
- 21923 Thompson Square
- 21925 Thompson Square
- 21921 Thompson Square
- 21927 Thompson Square
- 21938 Thompson Square
- 45464 Baggett Terrace
- 45480 Baggett Terrace
- 45451 Baggett Terrace
- 21931 Thompson Square