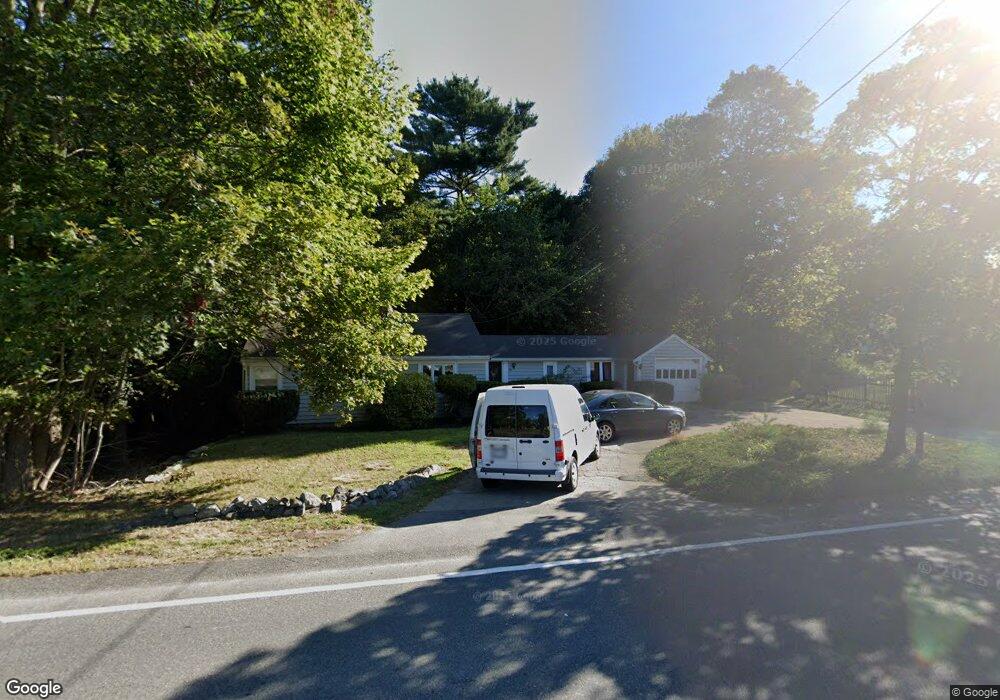
455 Circuit St Hanover, MA 02339
Estimated Value: $520,000 - $608,000
2
Beds
2
Baths
1,133
Sq Ft
$511/Sq Ft
Est. Value
About This Home
This home is located at 455 Circuit St, Hanover, MA 02339 and is currently estimated at $578,455, approximately $510 per square foot. 455 Circuit St is a home located in Plymouth County with nearby schools including Hanover High School and Cardinal Cushing Centers.
Ownership History
Date
Name
Owned For
Owner Type
Purchase Details
Closed on
Jan 29, 2013
Sold by
Killeen Robin E and Doolittle Robert G
Bought by
Doolittle Robert G
Current Estimated Value
Purchase Details
Closed on
Aug 29, 1997
Sold by
Jarrett Jeremiah N and Jarrett Helen C
Bought by
Doolittle Roger G and Jarrett Helen C
Purchase Details
Closed on
Sep 17, 1992
Sold by
Cunningham William E and Cunningham Laura L
Bought by
Jarrett Jeremiah N and Jarrett Helen C
Create a Home Valuation Report for This Property
The Home Valuation Report is an in-depth analysis detailing your home's value as well as a comparison with similar homes in the area
Home Values in the Area
Average Home Value in this Area
Purchase History
| Date | Buyer | Sale Price | Title Company |
|---|---|---|---|
| Doolittle Robert G | -- | -- | |
| Doolittle Roger G | $144,000 | -- | |
| Jarrett Jeremiah N | $131,000 | -- |
Source: Public Records
Mortgage History
| Date | Status | Borrower | Loan Amount |
|---|---|---|---|
| Previous Owner | Jarrett Jeremiah N | $100,000 | |
| Previous Owner | Jarrett Jeremiah N | $192,000 | |
| Previous Owner | Jarrett Jeremiah N | $192,000 |
Source: Public Records
Tax History Compared to Growth
Tax History
| Year | Tax Paid | Tax Assessment Tax Assessment Total Assessment is a certain percentage of the fair market value that is determined by local assessors to be the total taxable value of land and additions on the property. | Land | Improvement |
|---|---|---|---|---|
| 2025 | $6,013 | $486,900 | $280,000 | $206,900 |
| 2024 | $6,252 | $486,900 | $280,000 | $206,900 |
| 2023 | $5,810 | $430,700 | $254,700 | $176,000 |
| 2022 | $5,803 | $380,500 | $242,000 | $138,500 |
| 2021 | $5,413 | $331,500 | $196,900 | $134,600 |
| 2020 | $5,537 | $339,500 | $208,500 | $131,000 |
| 2019 | $5,333 | $325,000 | $208,500 | $116,500 |
| 2018 | $5,213 | $320,200 | $208,500 | $111,700 |
| 2017 | $5,143 | $311,300 | $204,700 | $106,600 |
| 2016 | $4,935 | $292,700 | $186,100 | $106,600 |
| 2015 | $4,307 | $266,700 | $172,400 | $94,300 |
Source: Public Records
Map
Nearby Homes