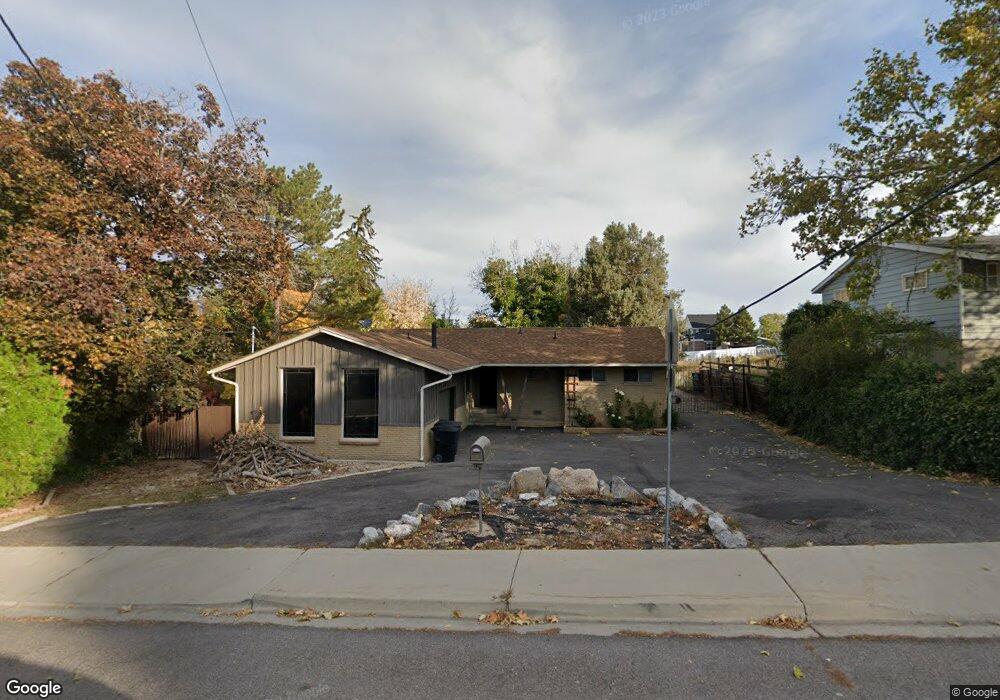
455 E 400 N Payson, UT 84651
Estimated Value: $473,801 - $530,000
2
Beds
2
Baths
1,512
Sq Ft
$326/Sq Ft
Est. Value
About This Home
This home is located at 455 E 400 N, Payson, UT 84651 and is currently estimated at $493,267, approximately $326 per square foot. 455 E 400 N is a home located in Utah County with nearby schools including Barnett Elementary School, Salem Junior High School, and Valley View Middle School.
Ownership History
Date
Name
Owned For
Owner Type
Purchase Details
Closed on
Jul 6, 2016
Sold by
Strong Rick E and Strong Family Trust
Bought by
Hyde Whitney and Nielsen Taylor
Current Estimated Value
Home Financials for this Owner
Home Financials are based on the most recent Mortgage that was taken out on this home.
Original Mortgage
$213,069
Outstanding Balance
$169,653
Interest Rate
3.5%
Mortgage Type
FHA
Estimated Equity
$323,614
Purchase Details
Closed on
Nov 4, 2013
Sold by
Strong Rick E
Bought by
Strong Rick E and Rick E Strong Family Trust
Purchase Details
Closed on
Mar 16, 2006
Sold by
Wilson Marilynn C and Alta Arlene Coombs Family Livi
Bought by
Strong Rick E and Strong Kaylynn
Home Financials for this Owner
Home Financials are based on the most recent Mortgage that was taken out on this home.
Original Mortgage
$119,900
Interest Rate
6.19%
Mortgage Type
Fannie Mae Freddie Mac
Create a Home Valuation Report for This Property
The Home Valuation Report is an in-depth analysis detailing your home's value as well as a comparison with similar homes in the area
Home Values in the Area
Average Home Value in this Area
Purchase History
| Date | Buyer | Sale Price | Title Company |
|---|---|---|---|
| Hyde Whitney | -- | North American Title | |
| Strong Rick E | -- | None Available | |
| Strong Rick E | -- | None Available | |
| Strong Rick E | -- | Pro Title & Escrow Inc |
Source: Public Records
Mortgage History
| Date | Status | Borrower | Loan Amount |
|---|---|---|---|
| Open | Hyde Whitney | $213,069 | |
| Previous Owner | Strong Rick E | $119,900 |
Source: Public Records
Tax History
| Year | Tax Paid | Tax Assessment Tax Assessment Total Assessment is a certain percentage of the fair market value that is determined by local assessors to be the total taxable value of land and additions on the property. | Land | Improvement |
|---|---|---|---|---|
| 2025 | $2,149 | $241,450 | -- | -- |
| 2024 | $2,149 | $218,735 | $0 | $0 |
| 2023 | $2,011 | $205,260 | $0 | $0 |
| 2022 | $2,094 | $210,210 | $0 | $0 |
| 2021 | $1,775 | $285,800 | $106,700 | $179,100 |
| 2020 | $1,644 | $258,900 | $92,800 | $166,100 |
| 2019 | $1,412 | $228,000 | $83,600 | $144,400 |
| 2018 | $1,382 | $215,000 | $70,600 | $144,400 |
| 2017 | $1,379 | $115,445 | $0 | $0 |
| 2016 | $1,295 | $107,690 | $0 | $0 |
| 2015 | $1,156 | $95,425 | $0 | $0 |
| 2014 | $1,117 | $92,895 | $0 | $0 |
Source: Public Records
Map
Nearby Homes
- 443 E 450 N
- 433 E 450 N
- 446 N 460 E Unit 9
- 468 N 460 E Unit LOT 7
- 339 N 500 E Unit 3
- 327 N 500 E Unit 2
- 331 N 500 E Unit 2
- 390 N 200 E
- 574 N 450 E
- 643 E 400 N
- 682 N 500 E
- 1287 N 1390 E Unit 25-96
- 118 E 100 N
- 195 W 300 N
- 873 E 200 N
- 116 E 100 S
- 862 E 200 S
- 1058 E 100 N
- 252 S 400 E
- 361 W 625 N Unit A-D
Your Personal Tour Guide
Ask me questions while you tour the home.