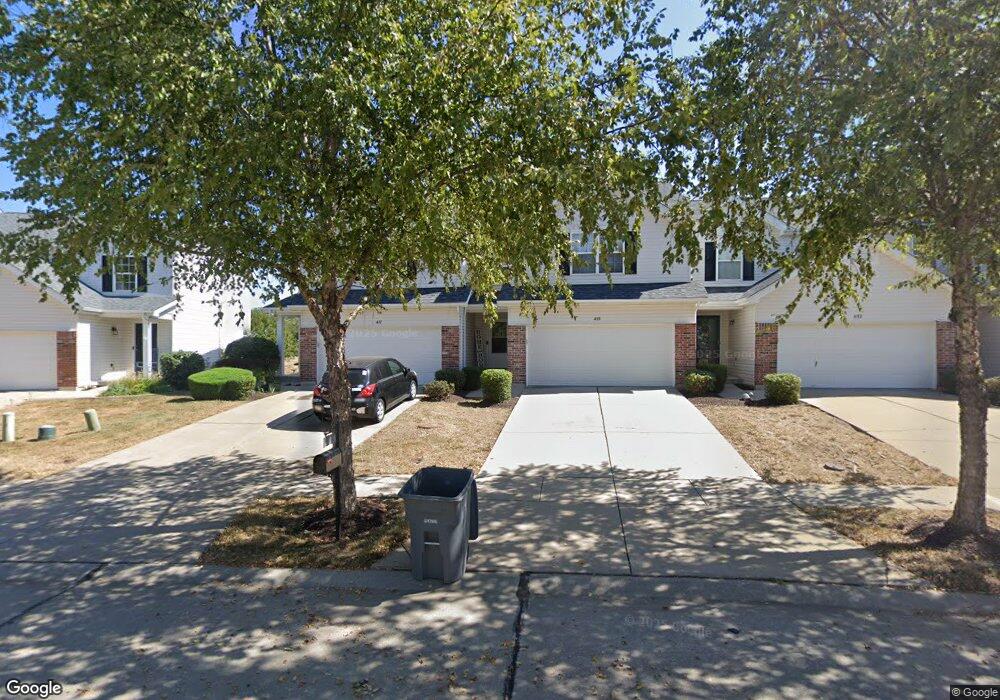
455 Flowering Magnolia Lot 224c Dr O Fallon, MO 63366
Estimated Value: $283,000 - $294,000
3
Beds
2
Baths
1,728
Sq Ft
$167/Sq Ft
Est. Value
About This Home
This home is located at 455 Flowering Magnolia Lot 224c Dr, O Fallon, MO 63366 and is currently estimated at $287,932, approximately $166 per square foot. 455 Flowering Magnolia Lot 224c Dr is a home located in St. Charles County with nearby schools including Joseph L. Mudd Elementary School, Forest Park Elementary School, and Fort Zumwalt West Middle School.
Ownership History
Date
Name
Owned For
Owner Type
Purchase Details
Closed on
Jul 8, 2021
Sold by
Bax Andrew and Bax Andy
Bought by
Bax Andrew and Bax Tom
Current Estimated Value
Purchase Details
Closed on
Dec 5, 2011
Sold by
Secretary Of Housing & Urban Development
Bought by
Bax Andy
Purchase Details
Closed on
Apr 27, 2011
Sold by
Citimortgage Inc
Bought by
Secretary Of Housing & Urban Development
Purchase Details
Closed on
Mar 17, 2011
Sold by
Blatt Lisa Marie and Pratt Randall A
Bought by
Citimortgage Inc
Purchase Details
Closed on
Apr 29, 2008
Sold by
Pratt Randall A
Bought by
Pratt Randall A and Blatt Lisa Marie
Purchase Details
Closed on
Feb 14, 2008
Sold by
Mcbride & Son Homes Inc
Bought by
Pratt Randall A
Home Financials for this Owner
Home Financials are based on the most recent Mortgage that was taken out on this home.
Original Mortgage
$155,142
Interest Rate
5.88%
Mortgage Type
FHA
Create a Home Valuation Report for This Property
The Home Valuation Report is an in-depth analysis detailing your home's value as well as a comparison with similar homes in the area
Home Values in the Area
Average Home Value in this Area
Purchase History
| Date | Buyer | Sale Price | Title Company |
|---|---|---|---|
| Bax Andrew | -- | Title Partners Agency Llc | |
| Bax Andy | $98,511 | Northwest Title Agency | |
| Secretary Of Housing & Urban Development | -- | None Available | |
| Citimortgage Inc | $195,603 | None Available | |
| Pratt Randall A | -- | None Available | |
| Pratt Randall A | -- | Sec |
Source: Public Records
Mortgage History
| Date | Status | Borrower | Loan Amount |
|---|---|---|---|
| Previous Owner | Pratt Randall A | $155,142 |
Source: Public Records
Tax History Compared to Growth
Tax History
| Year | Tax Paid | Tax Assessment Tax Assessment Total Assessment is a certain percentage of the fair market value that is determined by local assessors to be the total taxable value of land and additions on the property. | Land | Improvement |
|---|---|---|---|---|
| 2025 | $3,208 | $51,492 | -- | -- |
| 2023 | $3,209 | $48,380 | $0 | $0 |
| 2022 | $2,752 | $38,534 | $0 | $0 |
| 2021 | $2,754 | $38,534 | $0 | $0 |
| 2020 | $2,428 | $32,908 | $0 | $0 |
| 2019 | $2,434 | $32,908 | $0 | $0 |
| 2018 | $2,268 | $29,258 | $0 | $0 |
| 2017 | $2,233 | $29,258 | $0 | $0 |
| 2016 | $2,015 | $26,299 | $0 | $0 |
| 2015 | $1,874 | $26,299 | $0 | $0 |
| 2014 | $1,923 | $26,549 | $0 | $0 |
Source: Public Records
Map
Nearby Homes
- 474 Flowering Magnolia Dr
- 424 Flowering Magnolia Dr
- 116 Columbia Meadows Ln
- 33 Orchid Ct
- 206 Discovery Meadows (M)
- 134 Columbia Meadows Ln
- 135 Columbia Meadows Ln
- 208 Discovery Meadows Place
- The Grand Magnolia Plan at Columbia Meadows
- The Magnolia Plan at Columbia Meadows
- The Grand Columbia II Plan at Columbia Meadows
- The Grand Columbia Plan at Columbia Meadows
- The Columbia Plan at Columbia Meadows
- 4 Challenger Ct
- 210 Discovery Meadows Place
- 212 Discovery Meadows Place
- 136 Columbia Meadows Ln
- 214 Discovery Meadows Place
- 6 Challenger (Columbia) Ct
- 2 Challenger (Magnolia) Ct
- 460 Flowering Magnolia Dr
- 451 Flowering Magnolia Dr
- 452 Flowering Magnolia Dr
- 457 Flowering Magnolia Dr
- 455 Flowering Magnolia Dr
- 453 Flowering Magnolia Dr
- 453 Flowering Magnolia Dr
- 459 Flowering Magnolia Dr
- 448 Flowering Magnolia Dr
- 454 Flowering Magnolia Dr
- 449 Flowering Magnolia Dr
- 447 Flowering Magnolia Dr
- 461 Flowering Magnolia Dr
- 442 Flowering Magnolia Dr
- 462 Flowering Magnolia Dr
- 445 Flowering Magnolia Dr
- 465 Flowering Magnolia Dr
- 443 Flowering Magnolia Dr
- 463 Flowering Magnolia Dr
- 464 Flowering Magnolia Dr