
Seller's Agent in 2024
Kimberly Holthaus
Cedar Valley Property Solutions - Decorah
(563) 419-0273
52 Total Sales
Estimated Value: $147,000 - $154,000
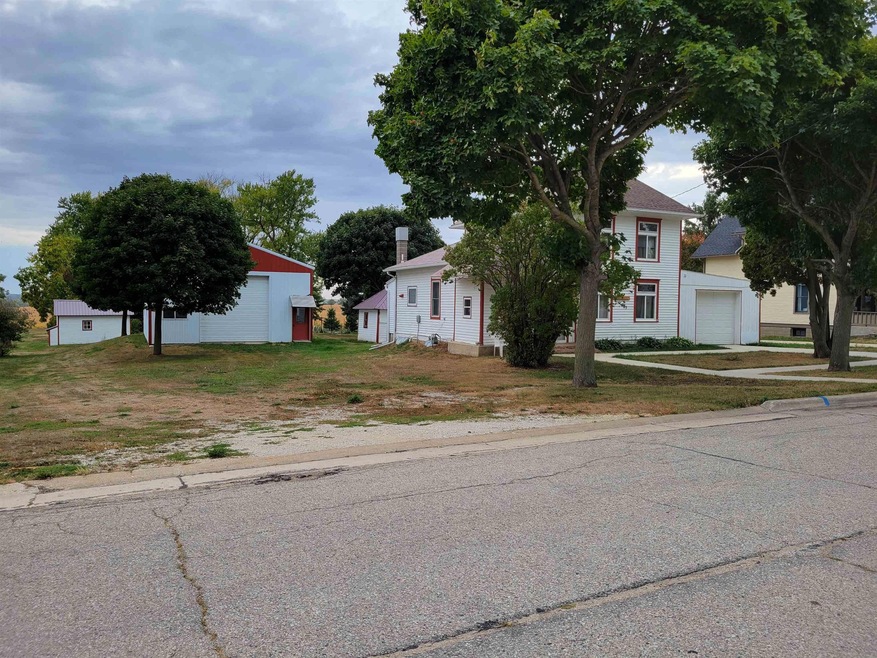
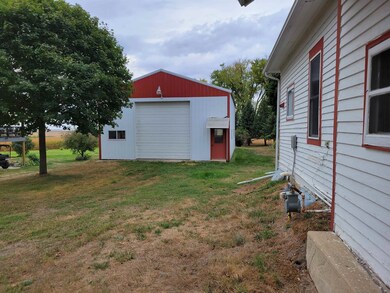
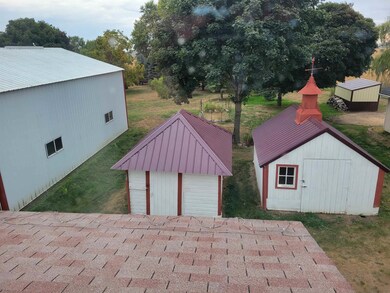
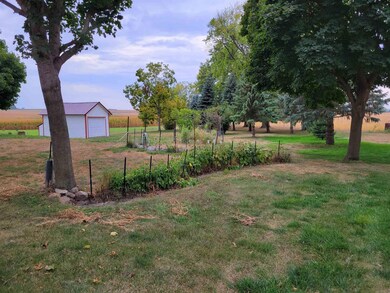
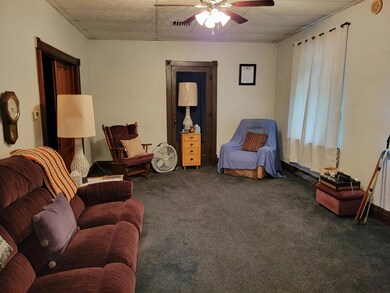
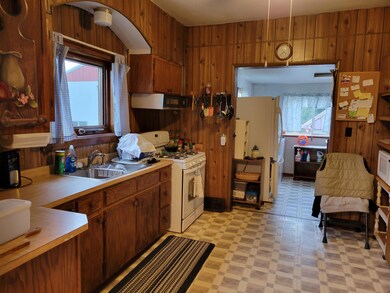
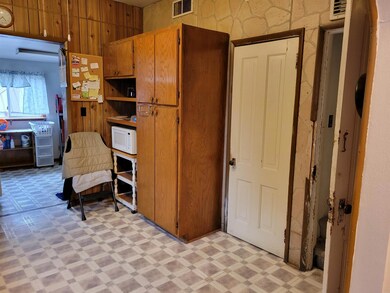
This property is almost like living on an acreage, but with the ease of city water and city sewer!! 3 br, 1 bath, single car attached garage, with a large 28' x 40' Machine Shed and multiple other outbuildings! Ridgeway is a great place to call home!
Last Agent to Sell the Property
Cedar Valley Property Solutions - Decorah License #S41482 Listed on: 12/20/2023
| Date | Buyer | Sale Price | Title Company |
|---|---|---|---|
| Sims Cory S | $133,000 | None Listed On Document |
| Date | Event | Price | List to Sale | Price per Sq Ft |
|---|---|---|---|---|
| 05/17/2024 05/17/24 | Sold | $133,000 | -18.2% | $90 / Sq Ft |
| 03/22/2024 03/22/24 | Pending | -- | -- | -- |
| 02/02/2024 02/02/24 | Price Changed | $162,500 | -7.1% | $110 / Sq Ft |
| 01/16/2024 01/16/24 | Price Changed | $175,000 | -5.4% | $118 / Sq Ft |
| 01/02/2024 01/02/24 | For Sale | $185,000 | 0.0% | $125 / Sq Ft |
| 12/26/2023 12/26/23 | Pending | -- | -- | -- |
| 12/20/2023 12/20/23 | For Sale | $185,000 | -- | $125 / Sq Ft |
| Year | Tax Paid | Tax Assessment Tax Assessment Total Assessment is a certain percentage of the fair market value that is determined by local assessors to be the total taxable value of land and additions on the property. | Land | Improvement |
|---|---|---|---|---|
| 2025 | $2,222 | $151,880 | $15,300 | $136,580 |
| 2024 | $2,222 | $132,180 | $15,300 | $116,880 |
| 2023 | $1,886 | $132,180 | $15,300 | $116,880 |
| 2022 | $1,652 | $114,820 | $12,750 | $102,070 |
| 2021 | $1,566 | $107,250 | $12,750 | $94,500 |
| 2020 | $1,566 | $99,370 | $12,750 | $86,620 |
| 2019 | $1,482 | $99,370 | $0 | $0 |
| 2018 | $1,412 | $99,370 | $0 | $0 |
| 2017 | $1,274 | $87,780 | $0 | $0 |
| 2016 | $1,224 | $87,780 | $0 | $0 |
| 2015 | $1,164 | $84,330 | $0 | $0 |
| 2014 | $1,112 | $84,330 | $0 | $0 |
Seller's Agent in 2024
Kimberly Holthaus
Cedar Valley Property Solutions - Decorah
(563) 419-0273
52 Total Sales
Buyer's Agent in 2024
D.J. Friest
Friest & Associates
(563) 419-0462
68 Total Sales
Source: Northeast Iowa Regional Board of REALTORS®
MLS Number: NBR20235255
APN: 092325301000
Disclaimer: Certain information contained herein is derived from information provided by parties other than Homes.com. All information provided is deemed reliable, but is not guaranteed to be accurate and should be independently verified.
![]() Based on information submitted to the MLS GRID. All data is obtained from various sources and may not have been verified by broker or MLS GRID. Supplied Open House Information is subject to change without notice. All information should be independently reviewed and verified for accuracy. Properties may or may not be listed by the office/agent presenting the information. Some IDX listings have been excluded from this website. IDX information is provided exclusively for personal, non-commercial use, and may not be used for any purpose other than to identify prospective properties consumers may be interested in purchasing. Information is deemed reliable but not guaranteed.
Based on information submitted to the MLS GRID. All data is obtained from various sources and may not have been verified by broker or MLS GRID. Supplied Open House Information is subject to change without notice. All information should be independently reviewed and verified for accuracy. Properties may or may not be listed by the office/agent presenting the information. Some IDX listings have been excluded from this website. IDX information is provided exclusively for personal, non-commercial use, and may not be used for any purpose other than to identify prospective properties consumers may be interested in purchasing. Information is deemed reliable but not guaranteed.
Based on information submitted to the MLS GRID
Ask me questions while you tour the home.