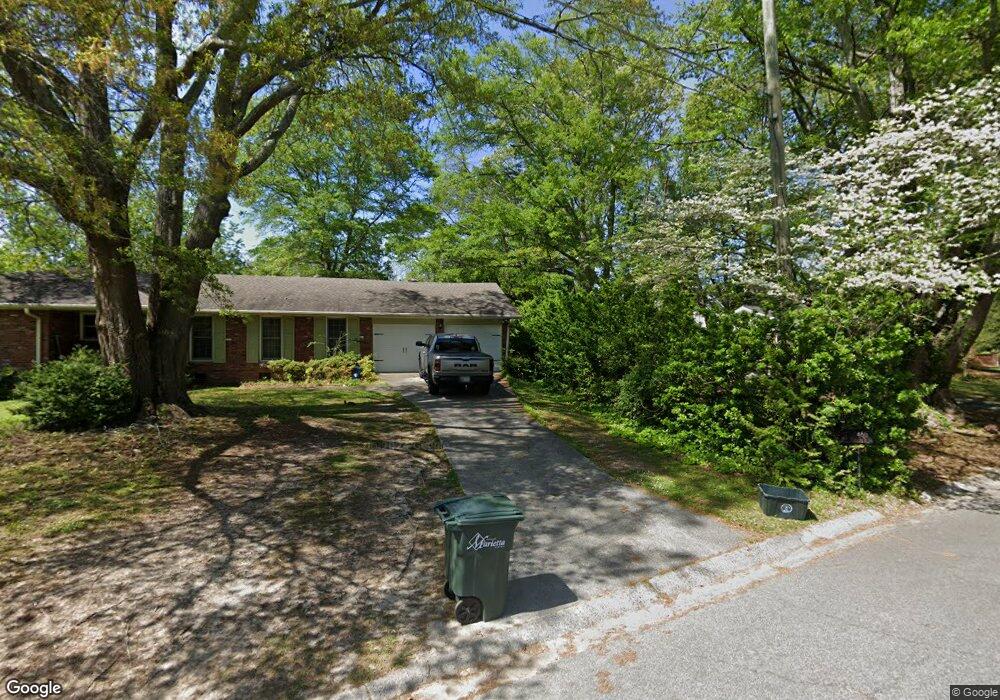
455 Whitlock Ave SW Marietta, GA 30064
Southwestern Marietta NeighborhoodEstimated Value: $490,105
--
Bed
--
Bath
--
Sq Ft
4.59
Acres
About This Home
This home is located at 455 Whitlock Ave SW, Marietta, GA 30064 and is currently estimated at $490,105. 455 Whitlock Ave SW is a home located in Cobb County with nearby schools including A.L. Burruss Elementary School, Marietta Sixth Grade Academy, and Marietta Middle School.
Ownership History
Date
Name
Owned For
Owner Type
Purchase Details
Closed on
May 13, 2009
Sold by
Henderson Charles T
Bought by
Barnes Roy E and Barnes Marie D
Current Estimated Value
Purchase Details
Closed on
Oct 26, 2006
Sold by
Davidson Gary L and Davidson Judy A
Bought by
Barnes Toy E and Barnes Marie D
Purchase Details
Closed on
Jun 3, 1997
Sold by
Owens Doris B
Bought by
Davidson Gary L and Davidson Judy A
Home Financials for this Owner
Home Financials are based on the most recent Mortgage that was taken out on this home.
Original Mortgage
$166,500
Interest Rate
8.13%
Mortgage Type
New Conventional
Purchase Details
Closed on
Nov 18, 1994
Sold by
Glore John A
Bought by
Morgan James F Marie B
Purchase Details
Closed on
Jul 27, 1993
Sold by
Cummins David X Martha B
Bought by
Owens Doris B
Home Financials for this Owner
Home Financials are based on the most recent Mortgage that was taken out on this home.
Original Mortgage
$92,088
Interest Rate
7.39%
Mortgage Type
Purchase Money Mortgage
Create a Home Valuation Report for This Property
The Home Valuation Report is an in-depth analysis detailing your home's value as well as a comparison with similar homes in the area
Home Values in the Area
Average Home Value in this Area
Purchase History
| Date | Buyer | Sale Price | Title Company |
|---|---|---|---|
| Barnes Roy E | -- | -- | |
| Barnes Roy E | $200,000 | -- | |
| Barnes Toy E | $360,000 | -- | |
| Davidson Gary L | $185,000 | -- | |
| Morgan James F Marie B | $72,500 | -- | |
| Owens Doris B | $100,000 | -- |
Source: Public Records
Mortgage History
| Date | Status | Borrower | Loan Amount |
|---|---|---|---|
| Previous Owner | Davidson Gary L | $166,500 | |
| Previous Owner | Owens Doris B | $92,088 |
Source: Public Records
Tax History Compared to Growth
Tax History
| Year | Tax Paid | Tax Assessment Tax Assessment Total Assessment is a certain percentage of the fair market value that is determined by local assessors to be the total taxable value of land and additions on the property. | Land | Improvement |
|---|---|---|---|---|
| 2025 | $325 | $38,440 | $32,000 | $6,440 |
| 2024 | $325 | $38,440 | $32,000 | $6,440 |
| 2023 | $325 | $38,440 | $32,000 | $6,440 |
| 2022 | $316 | $37,400 | $32,000 | $5,400 |
| 2021 | $321 | $37,400 | $32,000 | $5,400 |
| 2020 | $321 | $37,400 | $32,000 | $5,400 |
| 2019 | $282 | $32,880 | $28,000 | $4,880 |
| 2018 | $282 | $32,880 | $28,000 | $4,880 |
| 2017 | $227 | $32,880 | $28,000 | $4,880 |
| 2016 | $227 | $32,880 | $28,000 | $4,880 |
| 2015 | $244 | $32,480 | $28,000 | $4,480 |
| 2014 | $252 | $32,480 | $0 | $0 |
Source: Public Records
Map
Nearby Homes
- 32 Durham St SW
- 80 Lindley Ave NW Unit 1
- 199 Brookwood Dr SW
- 563 Hillandale Cir SW
- 325 Polk St NW
- 305 Brookwood Dr SW
- 740 Polk St NW
- 746 Polk St NW
- 282 Evelyn St NW
- 73 Whitlock Square SW
- 920 Wemberley Ln
- 798 Sentinel Ridge SW
- 260 Manning Rd SW Unit 110
- 25 Whitlock Square SW
- 909 Wemberley Ln
- 984 Wemberley Ln
- 327 Stewart Ave NW
- 204 Wakehurst Way
- 873 Cavalry Dr SW
- 475 Whitlock Ave SW
- 485 Whitlock Ave SW
- 466 Columbia Dr SW
- 454 Columbia Dr SW
- 40 Brookwood Dr SW
- 30 Brookwood Dr SW
- 60 Brookwood Dr SW
- 476 Columbia Dr SW
- 447 Whitlock Ave SW
- 20 Brookwood Dr SW
- 74 Brookwood Dr SW
- 518 518 Whitlock Ave
- 521 Whitlock Ave SW
- 86 Brookwood Dr SW
- 441 Whitlock Ave SW
- 465 Columbia Dr SW
- 518 Whitlock Ave NW
- 454 Whitlock Ave NW
- 488 Whitlock Ave NW
- 526 Whitlock Ave SW