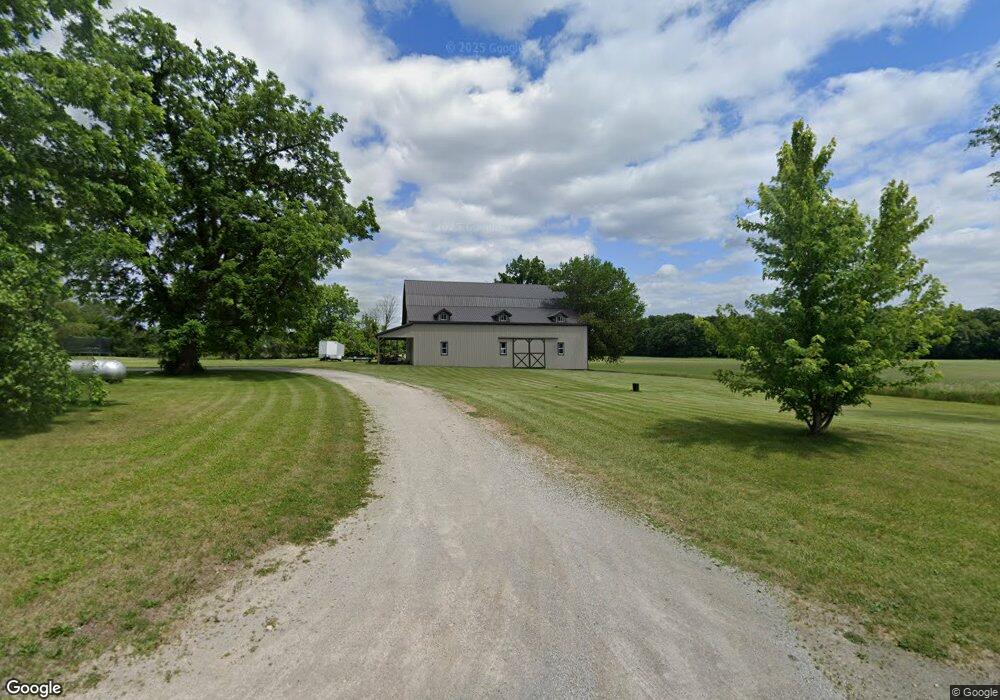
4550 County Road 11 Wauseon, OH 43567
Estimated Value: $190,000 - $238,000
3
Beds
2
Baths
1,652
Sq Ft
$127/Sq Ft
Est. Value
About This Home
This home is located at 4550 County Road 11, Wauseon, OH 43567 and is currently estimated at $209,041, approximately $126 per square foot. 4550 County Road 11 is a home located in Fulton County with nearby schools including Delta Elementary School, Pike-Delta-York Middle School, and Pike-Delta-York High School.
Ownership History
Date
Name
Owned For
Owner Type
Purchase Details
Closed on
Jan 13, 2025
Sold by
Olejniczak Gelen X and Olejniczak Joseph T
Bought by
Olejniczak Joseph T and Olejniczak Helen Jimena
Current Estimated Value
Purchase Details
Closed on
Jan 12, 2005
Sold by
Olejniczak Joseph T
Bought by
Olejniczak Joseph T and Olejniczak Gelen X
Purchase Details
Closed on
Oct 20, 2003
Sold by
Villagomez Rafael and Villagomez Juana
Bought by
Olejniczak Joseph T
Home Financials for this Owner
Home Financials are based on the most recent Mortgage that was taken out on this home.
Original Mortgage
$84,000
Interest Rate
6.02%
Mortgage Type
Purchase Money Mortgage
Purchase Details
Closed on
Feb 21, 2003
Sold by
Jacobs Vance
Bought by
Martinez Rafael Villagomez Rene S
Home Financials for this Owner
Home Financials are based on the most recent Mortgage that was taken out on this home.
Original Mortgage
$99,000
Interest Rate
6.06%
Mortgage Type
New Conventional
Purchase Details
Closed on
Oct 22, 1999
Sold by
Green Harold W
Bought by
Jacobs Vance
Purchase Details
Closed on
Sep 13, 1996
Sold by
Green Harold W
Bought by
Hodges Ronald B and Hodges Hope V
Create a Home Valuation Report for This Property
The Home Valuation Report is an in-depth analysis detailing your home's value as well as a comparison with similar homes in the area
Home Values in the Area
Average Home Value in this Area
Purchase History
| Date | Buyer | Sale Price | Title Company |
|---|---|---|---|
| Olejniczak Joseph T | -- | None Listed On Document | |
| Olejniczak Joseph T | -- | None Listed On Document | |
| Olejniczak Joseph T | -- | None Listed On Document | |
| Olejniczak Joseph T | -- | -- | |
| Olejniczak Joseph T | $106,000 | -- | |
| Martinez Rafael Villagomez Rene S | $99,000 | -- | |
| Jacobs Vance | $71,000 | -- | |
| Hodges Ronald B | $60,000 | -- |
Source: Public Records
Mortgage History
| Date | Status | Borrower | Loan Amount |
|---|---|---|---|
| Previous Owner | Olejniczak Joseph T | $84,000 | |
| Previous Owner | Martinez Rafael Villagomez Rene S | $99,000 |
Source: Public Records
Tax History Compared to Growth
Tax History
| Year | Tax Paid | Tax Assessment Tax Assessment Total Assessment is a certain percentage of the fair market value that is determined by local assessors to be the total taxable value of land and additions on the property. | Land | Improvement |
|---|---|---|---|---|
| 2024 | $1,639 | $42,040 | $12,430 | $29,610 |
| 2023 | $1,640 | $42,040 | $12,430 | $29,610 |
| 2022 | $1,724 | $34,060 | $10,360 | $23,700 |
| 2021 | $1,756 | $34,060 | $10,360 | $23,700 |
| 2020 | $1,754 | $34,060 | $10,360 | $23,700 |
| 2019 | $1,519 | $30,420 | $9,490 | $20,930 |
| 2018 | $1,460 | $30,420 | $9,490 | $20,930 |
| 2017 | $1,440 | $30,420 | $9,490 | $20,930 |
| 2016 | $1,438 | $28,530 | $9,490 | $19,040 |
| 2015 | $1,364 | $28,530 | $9,490 | $19,040 |
| 2014 | $1,360 | $28,530 | $9,490 | $19,040 |
| 2013 | $1,395 | $28,880 | $9,450 | $19,430 |
Source: Public Records
Map
Nearby Homes
- 2872 County Road 11
- 911 Doris Dr
- 1066 Seneca Dr
- 1058 Seneca Dr
- 1090 Seneca Dr
- 1062 Seneca Dr
- Integrity 1830 Plan at Arrowhead Trails
- integrity 2280 Plan at Arrowhead Trails
- Integrity 2080 Plan at Arrowhead Trails
- 303 Eastwood St
- 00 Glenwood
- 0 Glenwood Unit 6124946
- 1209 Apache Dr
- 7373 County Road 12
- 527 E Elm St
- 320 Orth Rd
- 7620 County Road 12
- 139 Marshall St
- 217 Marshall St
- 125 Cherry St
- 4580 County Road 11
- 4621 County Road 11
- 4817 County Road 11
- 4182 County Road 11
- 11 County Road F
- 10977 County Road N Unit 8-2
- 10998 County Road N Unit 10-2
- 10930 County Road E Unit 10-2
- 10928 County Road N Unit 10-2
- 10924 County Road N Unit 7-1
- 10912 County Road N Unit 10-2
- 10775 County Road E
- 11120 County Road E
- 4049 County Road 11
- 10774 County Road N Unit 10-2
- 10728 County Road E
- 4017 County Road 11
- 10945 County Road D
- 4880 County Road 10 2
- 10835 County Road D