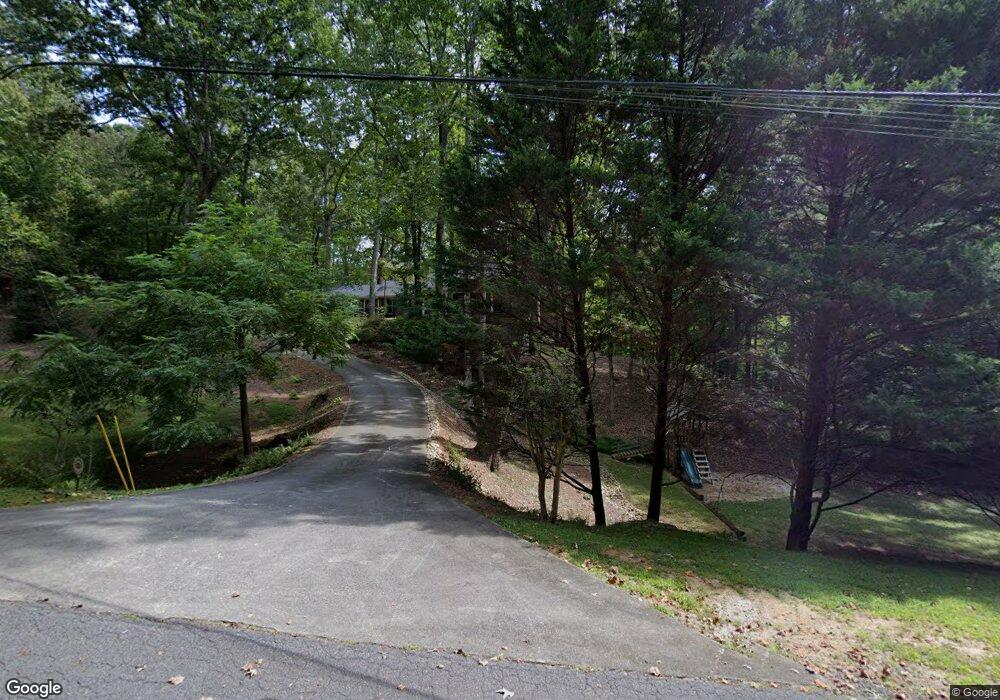
4550 Shoreline Dr Gainesville, GA 30506
Estimated Value: $631,012 - $697,000
3
Beds
3
Baths
3,127
Sq Ft
$212/Sq Ft
Est. Value
About This Home
This home is located at 4550 Shoreline Dr, Gainesville, GA 30506 and is currently estimated at $662,753, approximately $211 per square foot. 4550 Shoreline Dr is a home located in Hall County with nearby schools including Elbert Elementary School, Mount Vernon Elementary School, and North Hall Middle School.
Ownership History
Date
Name
Owned For
Owner Type
Purchase Details
Closed on
Mar 8, 2011
Sold by
Walker Christopher J
Bought by
Walker Kay R
Current Estimated Value
Home Financials for this Owner
Home Financials are based on the most recent Mortgage that was taken out on this home.
Original Mortgage
$126,000
Outstanding Balance
$4,864
Interest Rate
4.82%
Mortgage Type
Stand Alone Second
Estimated Equity
$657,889
Purchase Details
Closed on
Jan 31, 2011
Sold by
Walker Kay R
Bought by
Walker Kay R and Walker Christopher J
Home Financials for this Owner
Home Financials are based on the most recent Mortgage that was taken out on this home.
Original Mortgage
$126,000
Outstanding Balance
$4,864
Interest Rate
4.82%
Mortgage Type
Stand Alone Second
Estimated Equity
$657,889
Purchase Details
Closed on
Sep 10, 2008
Sold by
Walker Christopher J
Bought by
Walker Kay Reese
Purchase Details
Closed on
Jun 1, 1998
Sold by
Walker Christopher J
Bought by
Walker Kay Reese
Create a Home Valuation Report for This Property
The Home Valuation Report is an in-depth analysis detailing your home's value as well as a comparison with similar homes in the area
Home Values in the Area
Average Home Value in this Area
Purchase History
| Date | Buyer | Sale Price | Title Company |
|---|---|---|---|
| Walker Kay R | -- | -- | |
| Walker Kay R | -- | -- | |
| Walker Kay Reese | -- | -- | |
| Walker Kay Reese | -- | -- |
Source: Public Records
Mortgage History
| Date | Status | Borrower | Loan Amount |
|---|---|---|---|
| Open | Walker Kay R | $126,000 |
Source: Public Records
Tax History Compared to Growth
Tax History
| Year | Tax Paid | Tax Assessment Tax Assessment Total Assessment is a certain percentage of the fair market value that is determined by local assessors to be the total taxable value of land and additions on the property. | Land | Improvement |
|---|---|---|---|---|
| 2024 | $5,096 | $205,440 | $44,760 | $160,680 |
| 2023 | $3,141 | $142,040 | $5,200 | $136,840 |
| 2022 | $3,186 | $122,880 | $5,200 | $117,680 |
| 2021 | $3,026 | $114,560 | $4,280 | $110,280 |
| 2020 | $3,011 | $110,760 | $4,280 | $106,480 |
| 2019 | $2,890 | $105,360 | $4,280 | $101,080 |
| 2018 | $1,867 | $65,667 | $4,280 | $61,387 |
| 2017 | $1,848 | $65,667 | $4,280 | $61,387 |
| 2016 | $1,805 | $65,667 | $4,280 | $61,387 |
| 2015 | $1,819 | $65,667 | $4,280 | $61,387 |
| 2014 | $1,819 | $65,667 | $4,280 | $61,387 |
Source: Public Records
Map
Nearby Homes
- 4536 Shoreline Dr
- 4637 Shoreline Ln
- 4453 Harold Whelchel Rd
- 4532 Wahoo Dr
- 4301 Harold Whelchel Rd
- 4979 Letha Dr
- 4450 Roberta Cir
- 4486 Old Magnolia Ct
- 4243 Perry Dr
- 4227 Harold Whelchel Rd
- 4467 Tall Hickory Trail
- 4181 Perry Dr
- 4315 Post Oak Point
- 4618 Seminole Dr
- 4392 Mount Vernon Rd
- 4823 Hiawatha Dr
- 4959 Rilla Rd
- 4551 Shoreline Dr
- 4626 Shoreline Dr
- 4539 Shoreline Dr
- 4531 Shoreline Dr
- 0 Shoreline Ln Unit 7351225
- 0 Shoreline Ln
- 4525 Shoreline Dr
- 4625 Shoreline Ln Unit 7 & 8
- 4625 Shoreline Ln
- 4521 Shoreline Dr
- 4654 Shoreline Dr
- 4524 Shoreline Dr
- 4500 Shoreline Dr
- 0 Shoreline Dr Unit 8669877
- 0 Shoreline Dr Unit 8460311
- 0 Shoreline Dr Unit 7452156
- 0 Shoreline Dr Unit 7416609
- 0 Shoreline Dr Unit 8322542
- 0 Shoreline Dr Unit 8527435