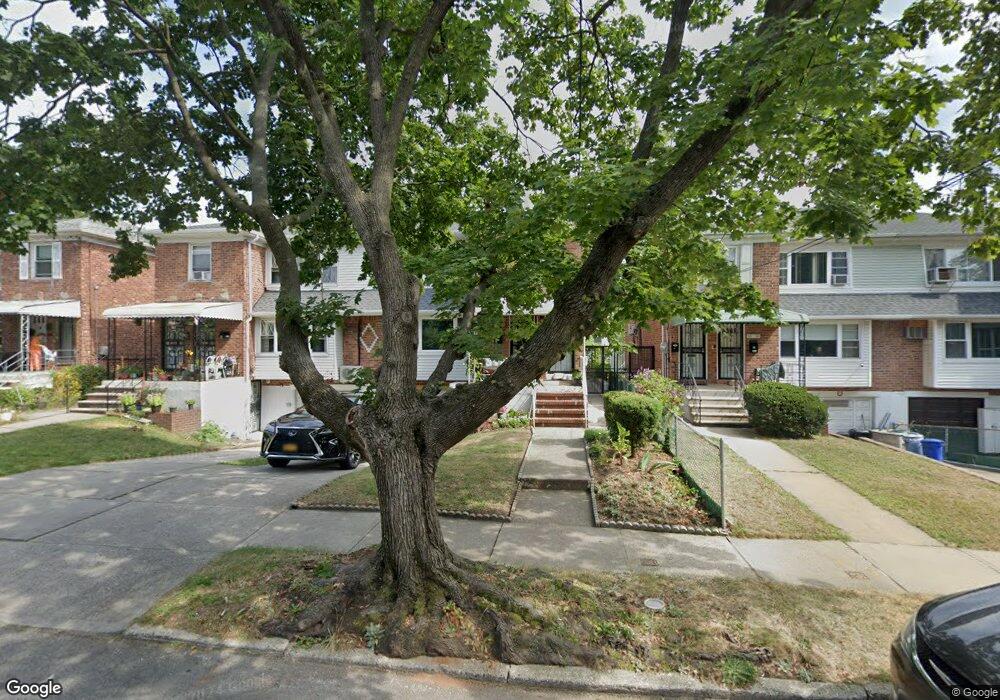
4551 165th St Flushing, NY 11358
East Flushing NeighborhoodEstimated Value: $1,289,128 - $1,527,000
4
Beds
2
Baths
2,204
Sq Ft
$659/Sq Ft
Est. Value
About This Home
This home is located at 4551 165th St, Flushing, NY 11358 and is currently estimated at $1,452,032, approximately $658 per square foot. 4551 165th St is a home located in Queens County with nearby schools including P.S. 107 Thomas A Dooley, I.S. 25 Adrien Block, and Francis Lewis High School.
Ownership History
Date
Name
Owned For
Owner Type
Purchase Details
Closed on
Feb 24, 2015
Sold by
Weng Yan Guang
Bought by
Huang Shuangyan and Qu Xiaofang
Current Estimated Value
Home Financials for this Owner
Home Financials are based on the most recent Mortgage that was taken out on this home.
Original Mortgage
$499,000
Outstanding Balance
$379,799
Interest Rate
3.67%
Mortgage Type
New Conventional
Estimated Equity
$1,072,233
Purchase Details
Closed on
Oct 8, 2010
Sold by
Weng Cai Yun and Weng Kai-Lun
Bought by
Weng Yan Guang
Purchase Details
Closed on
Aug 31, 2009
Sold by
Weng Yan Guang
Bought by
Weng Cai Yun and Weng Kai-Lun
Purchase Details
Closed on
Oct 8, 2008
Sold by
Durniak Mary Anne and Durniak Peter
Bought by
Weng Yan Guang
Home Financials for this Owner
Home Financials are based on the most recent Mortgage that was taken out on this home.
Original Mortgage
$450,000
Interest Rate
5.94%
Mortgage Type
Purchase Money Mortgage
Purchase Details
Closed on
May 2, 2000
Sold by
Durniak Peter and Durniak Mary Anne
Bought by
Durniak Peter and Durniak Mary Anne
Create a Home Valuation Report for This Property
The Home Valuation Report is an in-depth analysis detailing your home's value as well as a comparison with similar homes in the area
Home Values in the Area
Average Home Value in this Area
Purchase History
| Date | Buyer | Sale Price | Title Company |
|---|---|---|---|
| Huang Shuangyan | $915,000 | -- | |
| Huang Shuangyan | $915,000 | -- | |
| Huang Shuangyan | $915,000 | -- | |
| Weng Yan Guang | -- | -- | |
| Weng Yan Guang | -- | -- | |
| Weng Cai Yun | -- | -- | |
| Weng Cai Yun | -- | -- | |
| Weng Yan Guang | $710,000 | -- | |
| Weng Yan Guang | $710,000 | -- | |
| Durniak Peter | -- | -- | |
| Durniak Peter | -- | -- |
Source: Public Records
Mortgage History
| Date | Status | Borrower | Loan Amount |
|---|---|---|---|
| Open | Huang Shuangyan | $499,000 | |
| Closed | Huang Shuangyan | $499,000 | |
| Previous Owner | Weng Yan Guang | $450,000 |
Source: Public Records
Tax History
| Year | Tax Paid | Tax Assessment Tax Assessment Total Assessment is a certain percentage of the fair market value that is determined by local assessors to be the total taxable value of land and additions on the property. | Land | Improvement |
|---|---|---|---|---|
| 2025 | $11,585 | $62,346 | $18,406 | $43,940 |
| 2024 | $11,597 | $59,080 | $16,388 | $42,692 |
| 2023 | $10,914 | $55,738 | $15,289 | $40,449 |
| 2022 | $10,840 | $80,520 | $23,700 | $56,820 |
| 2021 | $11,293 | $79,860 | $23,700 | $56,160 |
| 2020 | $10,701 | $78,960 | $23,700 | $55,260 |
| 2019 | $10,006 | $69,120 | $23,700 | $45,420 |
| 2018 | $9,171 | $46,448 | $17,830 | $28,618 |
| 2017 | $9,169 | $46,448 | $19,394 | $27,054 |
| 2016 | $8,864 | $46,448 | $19,394 | $27,054 |
| 2015 | $5,065 | $43,296 | $24,182 | $19,114 |
| 2014 | $5,065 | $41,028 | $20,352 | $20,676 |
Source: Public Records
Map
Nearby Homes
- 163-02 45th Ave
- 45-74 164th St
- 43-58 163rd St
- 43-33 163rd St
- 4328 168th St
- 43-27 162nd St
- 4564 170th St
- 45-57 160th St
- 4344 161st St
- 4363 160th St
- 46-12 161st St Unit 1D
- 46-12 161st St Unit 2C
- 167-22 Northern Blvd
- 42-16 162nd St
- 45-19 158th St
- 47-21 162nd St
- 47-04 167th St
- 46-05 158th St
- 4018 165th St
- 47-23 164th St
Your Personal Tour Guide
Ask me questions while you tour the home.