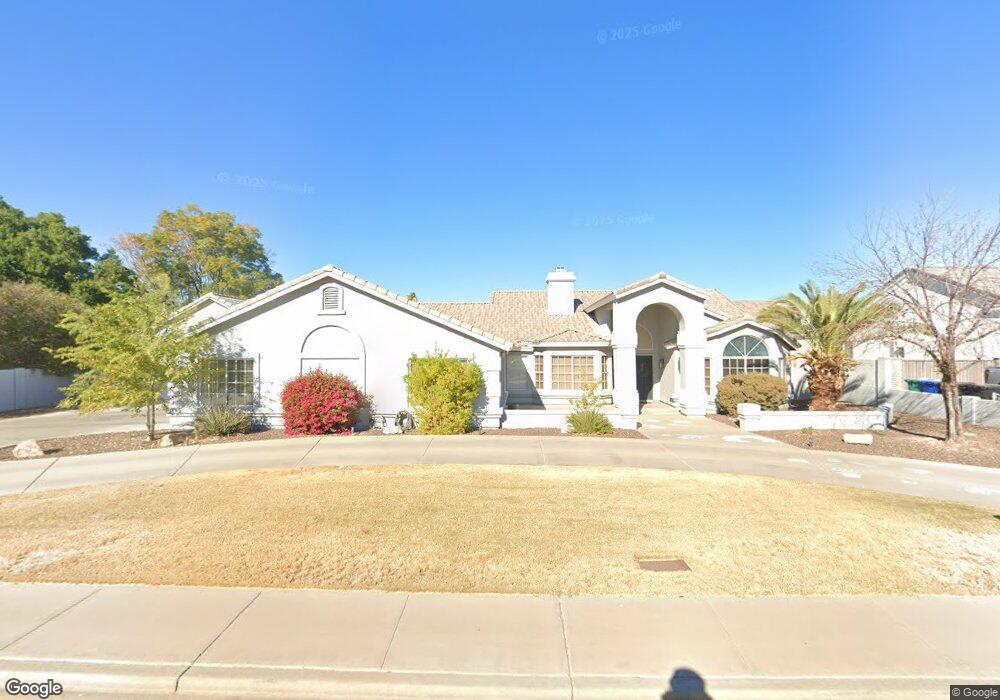
4552 E Enrose St Mesa, AZ 85205
Central Mesa East NeighborhoodEstimated Value: $623,000 - $826,000
4
Beds
3
Baths
2,580
Sq Ft
$287/Sq Ft
Est. Value
About This Home
This home is located at 4552 E Enrose St, Mesa, AZ 85205 and is currently estimated at $741,148, approximately $287 per square foot. 4552 E Enrose St is a home located in Maricopa County with nearby schools including O'Connor Elementary School, Franklin at Brimhall Elementary School, and Franklin West Elementary School.
Ownership History
Date
Name
Owned For
Owner Type
Purchase Details
Closed on
Apr 16, 2019
Sold by
Mackinlay Daniel and Mackinlay Kristen
Bought by
Mackinlay Daniel and Mackinlay Kristen
Current Estimated Value
Purchase Details
Closed on
Feb 23, 2010
Sold by
Hsbc Bank Usa National Association
Bought by
Mackinlay Daniel and Mackinlay Kristen
Purchase Details
Closed on
Jun 10, 2009
Sold by
Rost Robbie Dean
Bought by
Hsbc Bank Usa National Association
Purchase Details
Closed on
Jul 7, 2003
Sold by
Rost Virginia Ann and Rost Virginia A
Bought by
Rost Robbie Dean
Home Financials for this Owner
Home Financials are based on the most recent Mortgage that was taken out on this home.
Original Mortgage
$62,000
Interest Rate
5.13%
Mortgage Type
Stand Alone Second
Create a Home Valuation Report for This Property
The Home Valuation Report is an in-depth analysis detailing your home's value as well as a comparison with similar homes in the area
Home Values in the Area
Average Home Value in this Area
Purchase History
| Date | Buyer | Sale Price | Title Company |
|---|---|---|---|
| Mackinlay Daniel | -- | None Available | |
| Mackinlay Daniel | $200,000 | Equity Title Agency Inc | |
| Hsbc Bank Usa National Association | $263,500 | None Available | |
| Rost Robbie Dean | -- | Security Title Agency | |
| Rost Robbie Dean | $310,000 | Security Title Agency |
Source: Public Records
Mortgage History
| Date | Status | Borrower | Loan Amount |
|---|---|---|---|
| Previous Owner | Rost Robbie Dean | $62,000 | |
| Previous Owner | Rost Robbie Dean | $248,000 |
Source: Public Records
Tax History
| Year | Tax Paid | Tax Assessment Tax Assessment Total Assessment is a certain percentage of the fair market value that is determined by local assessors to be the total taxable value of land and additions on the property. | Land | Improvement |
|---|---|---|---|---|
| 2025 | $2,954 | $34,749 | -- | -- |
| 2024 | $2,985 | $33,094 | -- | -- |
| 2023 | $2,985 | $50,060 | $10,010 | $40,050 |
| 2022 | $2,921 | $41,070 | $8,210 | $32,860 |
| 2021 | $2,988 | $40,030 | $8,000 | $32,030 |
| 2020 | $2,947 | $32,700 | $6,540 | $26,160 |
| 2019 | $2,734 | $30,770 | $6,150 | $24,620 |
| 2018 | $2,608 | $29,150 | $5,830 | $23,320 |
| 2017 | $2,527 | $28,830 | $5,760 | $23,070 |
| 2016 | $2,481 | $28,280 | $5,650 | $22,630 |
| 2015 | $2,339 | $26,570 | $5,310 | $21,260 |
Source: Public Records
Map
Nearby Homes
- 4562 E Elmwood St
- 4556 E Downing St
- 4622 E Des Moines St
- 4429 E Downing Cir
- 4530 E Decatur St
- 4650 E Decatur St
- 4335 E Fox Cir
- 736 N Regent
- 4326 E Fairbrook Cir
- 4245 E Fountain St
- 4933 E Downing St
- 4913 E Fox St
- 4906 E Brown Rd Unit 38
- 5051 E Adobe St
- 5135 E Evergreen St Unit 1165
- 5135 E Evergreen St Unit 1253
- 5056 E Dallas St
- 5136 E Evergreen St Unit 1031
- 1244 N Norfolk Cir
- 1126 N Nassau
- 4560 E Enrose St Unit 63
- 4544 E Enrose St
- 4563 E Elmwood St
- 4605 E Elmwood Cir
- 4551 E Elmwood St
- 4553 E Enrose St
- 4545 E Enrose St
- 4561 E Enrose St
- 4606 E Enrose Cir
- 4532 E Enrose St
- 4537 E Enrose St
- 831 S Quinn
- 4539 E Elmwood St
- 832 N Quinn Cir
- 4606 E Elmwood Cir
- 4550 E Elmwood St
- 828 N 46th St
- 4628 E Enrose Cir
- 4619 E Enrose Cir
- 4618 E Elmwood Cir
Your Personal Tour Guide
Ask me questions while you tour the home.