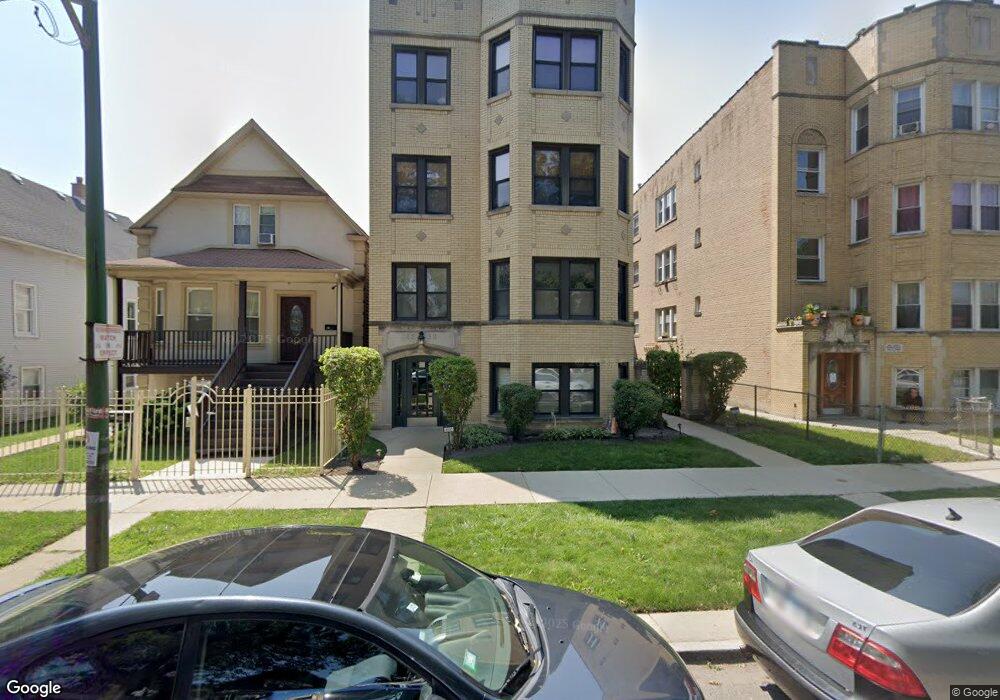
4552 N Drake Ave Unit 45521A Chicago, IL 60625
Albany Park NeighborhoodEstimated Value: $158,000 - $188,000
1
Bed
1
Bath
750
Sq Ft
$225/Sq Ft
Est. Value
About This Home
This home is located at 4552 N Drake Ave Unit 45521A, Chicago, IL 60625 and is currently estimated at $168,689, approximately $224 per square foot. 4552 N Drake Ave Unit 45521A is a home located in Cook County with nearby schools including Haugan Elementary School, Roosevelt High School, and ASPIRA Haugan Middle School.
Ownership History
Date
Name
Owned For
Owner Type
Purchase Details
Closed on
Sep 11, 2021
Sold by
Dabrowiecka Monika
Bought by
Mitricevic Filip and Mitricevic Miljana
Current Estimated Value
Home Financials for this Owner
Home Financials are based on the most recent Mortgage that was taken out on this home.
Original Mortgage
$102,400
Outstanding Balance
$86,329
Interest Rate
2.87%
Mortgage Type
New Conventional
Estimated Equity
$82,360
Purchase Details
Closed on
Mar 21, 2013
Sold by
Nowak Robert
Bought by
Dabrowiecka Monika
Purchase Details
Closed on
Apr 25, 2011
Sold by
Cherry James David
Bought by
Monika Nowak Robert and Monika Dabrowieka
Purchase Details
Closed on
Dec 5, 2006
Sold by
4550 & 52 N Drake Llc
Bought by
Cherry James David
Home Financials for this Owner
Home Financials are based on the most recent Mortgage that was taken out on this home.
Original Mortgage
$144,000
Interest Rate
5.87%
Mortgage Type
Unknown
Create a Home Valuation Report for This Property
The Home Valuation Report is an in-depth analysis detailing your home's value as well as a comparison with similar homes in the area
Home Values in the Area
Average Home Value in this Area
Purchase History
| Date | Buyer | Sale Price | Title Company |
|---|---|---|---|
| Mitricevic Filip | $128,000 | Chicago Title | |
| Dabrowiecka Monika | -- | None Available | |
| Monika Nowak Robert | $46,000 | Gmt | |
| Cherry James David | $180,000 | Heritage Title Company |
Source: Public Records
Mortgage History
| Date | Status | Borrower | Loan Amount |
|---|---|---|---|
| Open | Mitricevic Filip | $102,400 | |
| Previous Owner | Cherry James David | $144,000 |
Source: Public Records
Tax History Compared to Growth
Tax History
| Year | Tax Paid | Tax Assessment Tax Assessment Total Assessment is a certain percentage of the fair market value that is determined by local assessors to be the total taxable value of land and additions on the property. | Land | Improvement |
|---|---|---|---|---|
| 2024 | $674 | $12,808 | $1,365 | $11,443 |
| 2023 | $635 | $6,500 | $1,092 | $5,408 |
| 2022 | $635 | $6,500 | $1,092 | $5,408 |
| 2021 | $1,311 | $6,499 | $1,092 | $5,407 |
| 2020 | $1,037 | $4,639 | $565 | $4,074 |
| 2019 | $1,048 | $5,200 | $565 | $4,635 |
| 2018 | $1,031 | $5,200 | $565 | $4,635 |
| 2017 | $1,046 | $4,845 | $507 | $4,338 |
| 2016 | $974 | $4,845 | $507 | $4,338 |
| 2015 | $891 | $4,845 | $507 | $4,338 |
| 2014 | $1,462 | $7,851 | $468 | $7,383 |
| 2013 | $1,433 | $7,851 | $468 | $7,383 |
Source: Public Records
Map
Nearby Homes
- 4534 N Saint Louis Ave
- 4621 N Monticello Ave
- 4426 N Drake Ave
- 4619 N Lawndale Ave Unit 1
- 3550 W Montrose Ave Unit 107
- 4734 N Drake Ave
- 3733 W Sunnyside Ave
- 4515 N Hamlin Ave
- 3711 W Lawrence Ave
- 4438 N Spaulding Ave
- 4322 N Kimball Ave
- 4714 N Spaulding Ave
- 4249 N Central Park Ave
- 4304 N Lawndale Ave
- 3816 W Montrose Ave
- 3707 W Cullom Ave Unit 1
- 4246 N Kimball Ave
- 4906 N Drake Ave Unit 3
- 3618 W Ainslie St Unit 3W
- 4903 N Monticello Ave Unit 3
- 4552 N Drake Ave Unit 2A
- 4552 N Drake Ave Unit 1B
- 4550 N Drake Ave Unit 52
- 4552 N Drake Ave Unit 45522B
- 4552 N Drake Ave Unit 45522A
- 4552 N Drake Ave Unit 45523B
- 4550 N Drake Ave Unit 45501F
- 4552 N Drake Ave Unit 45523A
- 4552 N Drake Ave Unit 45502F
- 4550 N Drake Ave Unit 4550G
- 4552 N Drake Ave Unit 45521B
- 4550 N Drake Ave Unit 45503F
- 4550 N Drake Ave Unit 2F
- 4552 N Drake Ave Unit 1A
- 4552 N Drake Ave Unit 3B
- 4550 N Drake Ave Unit 1F
- 4550 N Drake Ave Unit 3F
- 4550 N Drake Ave Unit G
- 4554 N Drake Ave
- 4546 N Drake Ave