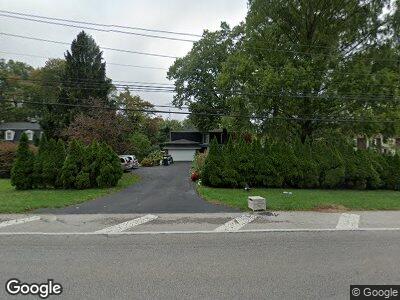
4552 W Laskey Rd Toledo, OH 43623
Franklin Park NeighborhoodEstimated Value: $261,000 - $318,000
4
Beds
3
Baths
2,284
Sq Ft
$128/Sq Ft
Est. Value
About This Home
This home is located at 4552 W Laskey Rd, Toledo, OH 43623 and is currently estimated at $292,074, approximately $127 per square foot. 4552 W Laskey Rd is a home located in Lucas County with nearby schools including Hill View Elementary School, Sylvania Arbor Hills Junior High School, and Sylvania Northview High School.
Ownership History
Date
Name
Owned For
Owner Type
Purchase Details
Closed on
Aug 13, 2018
Sold by
Khatib Wisam M and Khatib Wisam
Bought by
Khatib Wisam M and Hussein Samia Said
Current Estimated Value
Purchase Details
Closed on
Mar 17, 2009
Sold by
Wells Fargo Bank Na
Bought by
Khatib Wisam M
Purchase Details
Closed on
Aug 28, 2008
Sold by
Fillmore Brian J
Bought by
Wells Fargo Bank Na
Purchase Details
Closed on
Aug 13, 2003
Sold by
Fansler Mary Anne and Fansler Mary Ann
Bought by
Fillmore Brian J and Fillmore Heidi S
Home Financials for this Owner
Home Financials are based on the most recent Mortgage that was taken out on this home.
Original Mortgage
$170,000
Interest Rate
8.5%
Mortgage Type
Purchase Money Mortgage
Purchase Details
Closed on
Mar 31, 1999
Sold by
Fansler Wayne E and Fansler Mary A
Bought by
Fansler Wayne E and Fansler Mary Anne
Purchase Details
Closed on
Mar 29, 1994
Sold by
Westmeyer William R
Create a Home Valuation Report for This Property
The Home Valuation Report is an in-depth analysis detailing your home's value as well as a comparison with similar homes in the area
Home Values in the Area
Average Home Value in this Area
Purchase History
| Date | Buyer | Sale Price | Title Company |
|---|---|---|---|
| Khatib Wisam M | -- | None Available | |
| Khatib Wisam M | $117,000 | Nova Title Agency Inc | |
| Wells Fargo Bank Na | $113,334 | American 1St | |
| Fillmore Brian J | $170,000 | Metro Title Agency Inc | |
| Fansler Wayne E | -- | -- | |
| -- | $116,500 | -- |
Source: Public Records
Mortgage History
| Date | Status | Borrower | Loan Amount |
|---|---|---|---|
| Previous Owner | Fillmore Brian J | $22,000 | |
| Previous Owner | Fillmore Brian J | $193,500 | |
| Previous Owner | Fillmore Brian J | $170,000 | |
| Previous Owner | Fansler Wayne E | $47,543 |
Source: Public Records
Tax History Compared to Growth
Tax History
| Year | Tax Paid | Tax Assessment Tax Assessment Total Assessment is a certain percentage of the fair market value that is determined by local assessors to be the total taxable value of land and additions on the property. | Land | Improvement |
|---|---|---|---|---|
| 2024 | $2,369 | $83,055 | $12,635 | $70,420 |
| 2023 | $3,540 | $55,930 | $8,855 | $47,075 |
| 2022 | $3,570 | $55,930 | $8,855 | $47,075 |
| 2021 | $3,655 | $55,930 | $8,855 | $47,075 |
| 2020 | $3,382 | $47,355 | $7,420 | $39,935 |
| 2019 | $3,258 | $47,355 | $7,420 | $39,935 |
| 2018 | $3,562 | $47,355 | $7,420 | $39,935 |
| 2017 | $3,392 | $45,395 | $9,345 | $36,050 |
| 2016 | $4,105 | $129,700 | $26,700 | $103,000 |
| 2015 | $3,872 | $129,700 | $26,700 | $103,000 |
| 2014 | $3,671 | $43,650 | $9,000 | $34,650 |
| 2013 | $3,671 | $43,650 | $9,000 | $34,650 |
Source: Public Records
Map
Nearby Homes
- 5044 Larkhaven Dr
- 4811 Larkhaven Dr
- 5243 Flanders Rd
- 5257 N Oak Ct
- 5059 Avonhurst Rd
- 4144 W Laskey Rd
- 5336 Talmadge Rd
- 4042 Briarcrest Rd
- 4407 Rose Garden Dr
- 4415 Mockingbird Ln
- 4412 Old Saybrook Dr
- 4128 Oak Crest Rd
- 5036 Trellis Way
- 3939 W Laskey Rd
- 4928 Monac Dr
- 5021 Rudgate Blvd
- 4760 S Arvilla Dr
- 4213 Partridge Ln
- 5666 Talmadge Rd
- 4708 Turnbridge Rd
- 4552 W Laskey Rd
- 4560 W Laskey Rd
- 4542 W Laskey Rd
- 4553 Westbourne Rd
- 4541 Westbourne Rd
- 4561 Westbourne Rd
- 4604 W Laskey Rd
- 4533 Westbourne Rd
- 4567 Westbourne Rd
- 4612 W Laskey Rd
- 5011 Paddington Dr
- 5025 Paddington Dr
- 4552 Westbourne Rd
- 4542 Westbourne Rd
- 4562 Westbourne Rd
- 4571 Westbourne Rd
- 4618 W Laskey Rd
- 4534 Westbourne Rd
- 4566 Westbourne Rd
- 5043 Westbourne Rd