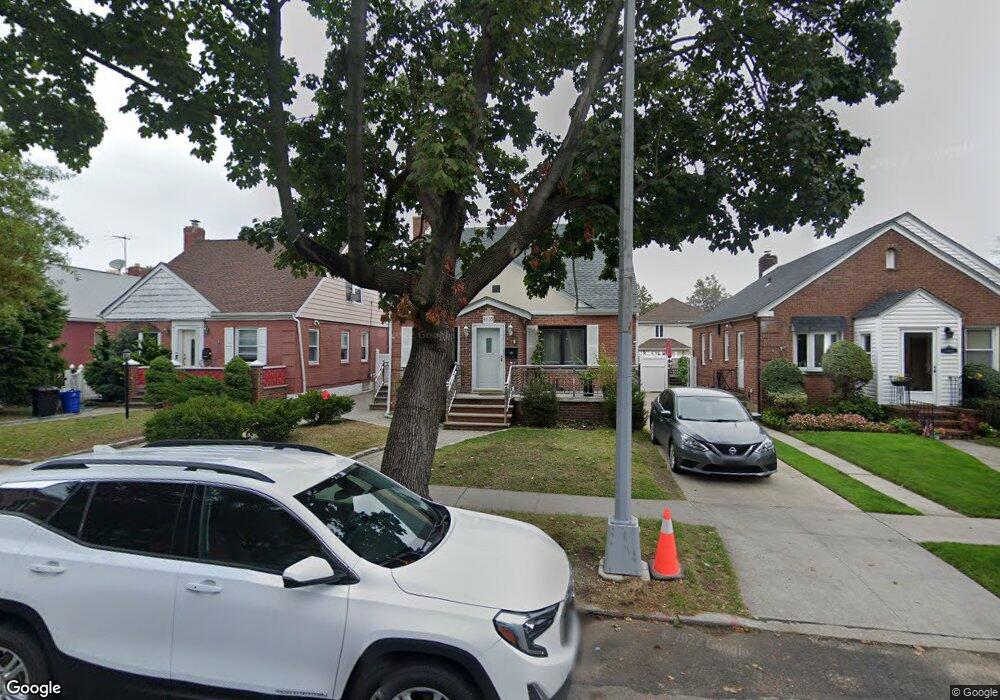
4555 195th St Flushing, NY 11358
Auburndale NeighborhoodEstimated Value: $1,088,000 - $1,220,000
Studio
--
Bath
1,114
Sq Ft
$1,024/Sq Ft
Est. Value
About This Home
This home is located at 4555 195th St, Flushing, NY 11358 and is currently estimated at $1,140,311, approximately $1,023 per square foot. 4555 195th St is a home located in Queens County with nearby schools including P.S. 107 Thomas A Dooley, I.S. 25 Adrien Block, and Francis Lewis High School.
Ownership History
Date
Name
Owned For
Owner Type
Purchase Details
Closed on
Oct 16, 2018
Sold by
Budhu Gobin and Prabhu Govind
Bought by
Zhu Gaoqiu and Zou Wenxia
Current Estimated Value
Home Financials for this Owner
Home Financials are based on the most recent Mortgage that was taken out on this home.
Original Mortgage
$552,000
Outstanding Balance
$482,401
Interest Rate
4.6%
Mortgage Type
Purchase Money Mortgage
Estimated Equity
$657,910
Create a Home Valuation Report for This Property
The Home Valuation Report is an in-depth analysis detailing your home's value as well as a comparison with similar homes in the area
Home Values in the Area
Average Home Value in this Area
Purchase History
| Date | Buyer | Sale Price | Title Company |
|---|---|---|---|
| Zhu Gaoqiu | $920,000 | -- |
Source: Public Records
Mortgage History
| Date | Status | Borrower | Loan Amount |
|---|---|---|---|
| Open | Zhu Gaoqiu | $552,000 |
Source: Public Records
Tax History
| Year | Tax Paid | Tax Assessment Tax Assessment Total Assessment is a certain percentage of the fair market value that is determined by local assessors to be the total taxable value of land and additions on the property. | Land | Improvement |
|---|---|---|---|---|
| 2025 | $8,376 | $42,816 | $13,499 | $29,317 |
| 2024 | $8,376 | $41,705 | $13,319 | $28,386 |
| 2023 | $7,944 | $39,554 | $12,263 | $27,291 |
| 2022 | $7,467 | $56,100 | $17,820 | $38,280 |
| 2021 | $7,510 | $54,540 | $17,820 | $36,720 |
| 2020 | $7,552 | $50,040 | $17,820 | $32,220 |
| 2019 | $7,270 | $51,660 | $17,820 | $33,840 |
| 2018 | $6,422 | $32,962 | $11,074 | $21,888 |
| 2017 | $6,054 | $31,170 | $11,401 | $19,769 |
| 2016 | $5,635 | $31,170 | $11,401 | $19,769 |
| 2015 | $3,327 | $29,733 | $13,368 | $16,365 |
| 2014 | $3,327 | $28,962 | $15,341 | $13,621 |
Source: Public Records
Map
Nearby Homes
- 45-31 195th St
- 4604 195th St
- 45-66 196th Place
- 45-47 193rd St
- 196-52 45th Dr
- 4539 192nd St
- 43-44 195th St
- 196-64 45th Ave
- 47-55 194th St
- 47-49 194th St
- 4756 196th St
- 4719 192nd St
- 199-04 47th Ave
- 47-02 Francis Lewis Blvd
- 200-38 45th Ave
- 4705 189th St
- 42-36 201st St
- 48-25 194th St
- 19005 48th Ave
- 45-32 Utopia Pkwy
Your Personal Tour Guide
Ask me questions while you tour the home.