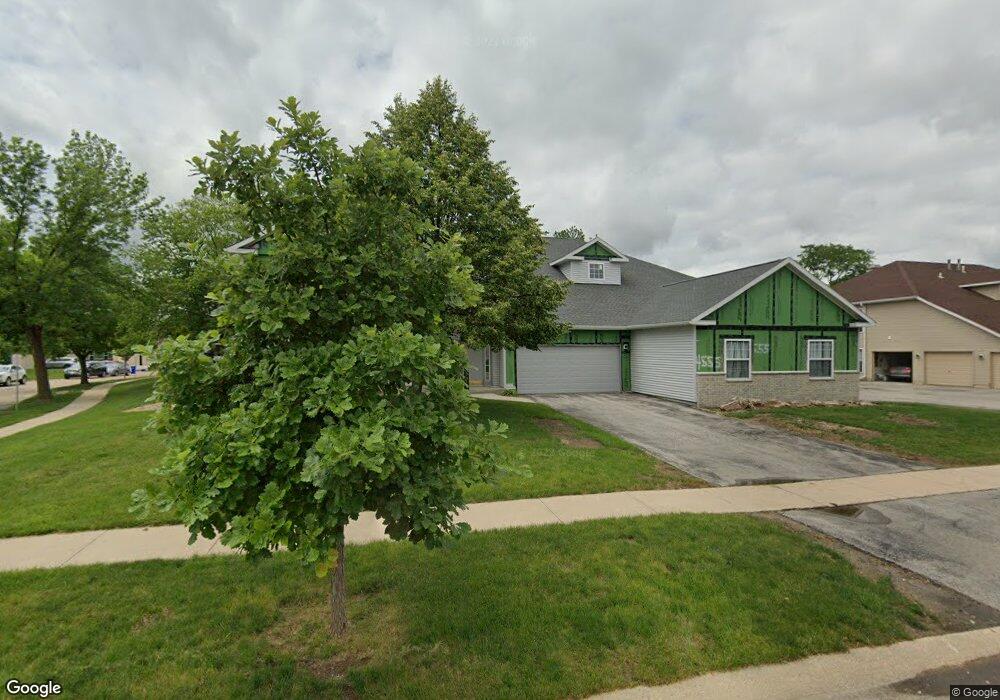
4555 Westchester Dr NE Unit D Cedar Rapids, IA 52402
Estimated Value: $153,000 - $169,000
2
Beds
2
Baths
1,340
Sq Ft
$122/Sq Ft
Est. Value
About This Home
This home is located at 4555 Westchester Dr NE Unit D, Cedar Rapids, IA 52402 and is currently estimated at $162,983, approximately $121 per square foot. 4555 Westchester Dr NE Unit D is a home located in Linn County with nearby schools including Ponderosa Elementary School, Pierce Elementary School, and Franklin Middle School.
Ownership History
Date
Name
Owned For
Owner Type
Purchase Details
Closed on
Sep 5, 2017
Sold by
Textor Jeffrey David
Bought by
Hegland Paul and Cassell Brooke
Current Estimated Value
Purchase Details
Closed on
Jun 10, 2009
Sold by
Textor Cindy Sue
Bought by
Textor Jeffrey David
Purchase Details
Closed on
Aug 6, 2008
Sold by
Boardman Daniel S
Bought by
Textor Jeffrey D
Home Financials for this Owner
Home Financials are based on the most recent Mortgage that was taken out on this home.
Original Mortgage
$105,210
Interest Rate
5.75%
Mortgage Type
Purchase Money Mortgage
Purchase Details
Closed on
Jun 21, 2002
Sold by
Beckett Julianne E
Bought by
Boardman Daniel S
Home Financials for this Owner
Home Financials are based on the most recent Mortgage that was taken out on this home.
Original Mortgage
$79,900
Interest Rate
7.25%
Create a Home Valuation Report for This Property
The Home Valuation Report is an in-depth analysis detailing your home's value as well as a comparison with similar homes in the area
Home Values in the Area
Average Home Value in this Area
Purchase History
| Date | Buyer | Sale Price | Title Company |
|---|---|---|---|
| Hegland Paul | -- | None Available | |
| Textor Jeffrey David | -- | None Available | |
| Textor Jeffrey D | $116,500 | None Available | |
| Boardman Daniel S | $93,500 | -- |
Source: Public Records
Mortgage History
| Date | Status | Borrower | Loan Amount |
|---|---|---|---|
| Previous Owner | Textor Jeffrey D | $105,210 | |
| Previous Owner | Boardman Daniel S | $79,900 |
Source: Public Records
Tax History Compared to Growth
Tax History
| Year | Tax Paid | Tax Assessment Tax Assessment Total Assessment is a certain percentage of the fair market value that is determined by local assessors to be the total taxable value of land and additions on the property. | Land | Improvement |
|---|---|---|---|---|
| 2025 | $2,398 | $148,800 | $23,000 | $125,800 |
| 2024 | $2,518 | $150,600 | $23,000 | $127,600 |
| 2023 | $2,518 | $146,000 | $23,000 | $123,000 |
| 2022 | $2,332 | $128,300 | $21,000 | $107,300 |
| 2021 | $2,464 | $121,500 | $19,000 | $102,500 |
| 2020 | $2,464 | $120,300 | $19,000 | $101,300 |
| 2019 | $2,218 | $111,400 | $19,000 | $92,400 |
| 2018 | $2,316 | $111,400 | $19,000 | $92,400 |
| 2017 | $2,316 | $107,500 | $11,000 | $96,500 |
| 2016 | $2,199 | $103,500 | $11,000 | $92,500 |
| 2015 | $2,307 | $108,434 | $11,000 | $97,434 |
| 2014 | $2,122 | $108,434 | $11,000 | $97,434 |
| 2013 | -- | $108,434 | $11,000 | $97,434 |
Source: Public Records
Map
Nearby Homes
- 4545 Westchester Dr NE Unit D
- 4645 Westchester Dr NE Unit A
- 4460 Westchester Dr NE Unit C
- 4745 Westchester Dr NE Unit A
- 4761 Westchester Dr NE Unit C
- 4433 Coventry Ln NE
- 4609 White Pine Dr NE
- 2520 Falbrook Dr NE
- 4417 Twin Pine Dr NE
- 4113 Lark Ct NE Unit 4113
- 4216 Marilyn Dr NE
- 2611 Brookland Dr NE
- 2400 Brookland Dr NE
- 4131 Blue Jay Dr NE Unit A
- 4131 Blue Jay Dr NE Unit C
- 3524 Swallow Ct NE
- 3604 Heatheridge Dr NE
- 3608 Foxborough Terrace NE Unit B
- 3719 Blue Mound Dr NE
- 3858 Northwood Dr NE
- 4555 Westchester Dr NE
- 4555 Westchester Dr NE
- 4555 Westchester Dr NE
- 4555 Westchester Dr NE Unit C
- 4605 Westchester Dr NE Unit C
- 4605 Westchester Dr NE
- 4605 Westchester Dr NE
- 4605 Westchester Dr NE Unit D
- 4545 Westchester Dr NE
- 4545 Westchester Dr NE
- 4545 Westchester Dr NE
- 4545 Westchester Dr NE Unit A
- 4505 Westchester Dr NE
- 4505 Westchester Dr NE
- 4505 Westchester Dr NE
- 4505 Westchester Dr NE Unit D
- 4505 Westchester Dr NE Unit B
- 4505 Westchester Dr NE Unit A
- 4600 Westchester Dr NE
- 4600 Westchester Dr NE