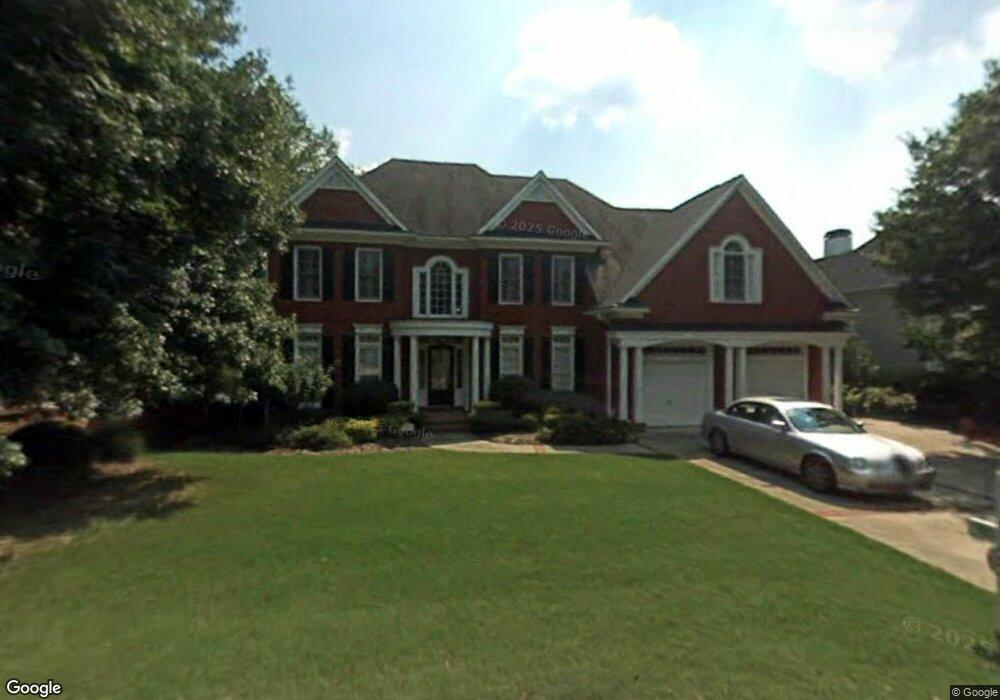
4556 Rutherford Dr Unit 4A Marietta, GA 30062
East Cobb NeighborhoodEstimated Value: $1,000,000 - $1,142,000
5
Beds
5
Baths
3,619
Sq Ft
$300/Sq Ft
Est. Value
About This Home
This home is located at 4556 Rutherford Dr Unit 4A, Marietta, GA 30062 and is currently estimated at $1,084,892, approximately $299 per square foot. 4556 Rutherford Dr Unit 4A is a home located in Cobb County with nearby schools including Mount Bethel Elementary School, Dodgen Middle School, and Walton High School.
Ownership History
Date
Name
Owned For
Owner Type
Purchase Details
Closed on
Feb 17, 2020
Sold by
Xin Zhenxing
Bought by
Xin Zhenxing and Wang Shaoni
Current Estimated Value
Purchase Details
Closed on
Oct 4, 2010
Sold by
Xin Zhenxing
Bought by
Xin Zhenxing
Purchase Details
Closed on
Aug 16, 2001
Sold by
Logun Brian H and Logun Loretta L
Bought by
Xin Zhen X
Home Financials for this Owner
Home Financials are based on the most recent Mortgage that was taken out on this home.
Original Mortgage
$275,000
Interest Rate
7.18%
Mortgage Type
New Conventional
Purchase Details
Closed on
May 21, 1998
Sold by
John Wieland Homes Inc
Bought by
Logun Brian H and Logun Loretta L
Home Financials for this Owner
Home Financials are based on the most recent Mortgage that was taken out on this home.
Original Mortgage
$372,010
Interest Rate
6.37%
Mortgage Type
New Conventional
Create a Home Valuation Report for This Property
The Home Valuation Report is an in-depth analysis detailing your home's value as well as a comparison with similar homes in the area
Home Values in the Area
Average Home Value in this Area
Purchase History
| Date | Buyer | Sale Price | Title Company |
|---|---|---|---|
| Xin Zhenxing | -- | -- | |
| Xin Zhenking | -- | None Available | |
| Xin Zhenxing | -- | -- | |
| Xin Zhen X | $550,000 | -- | |
| Logun Brian H | $468,900 | -- |
Source: Public Records
Mortgage History
| Date | Status | Borrower | Loan Amount |
|---|---|---|---|
| Previous Owner | Xin Zhen X | $275,000 | |
| Previous Owner | Logun Brian H | $372,010 |
Source: Public Records
Tax History Compared to Growth
Tax History
| Year | Tax Paid | Tax Assessment Tax Assessment Total Assessment is a certain percentage of the fair market value that is determined by local assessors to be the total taxable value of land and additions on the property. | Land | Improvement |
|---|---|---|---|---|
| 2025 | $2,382 | $385,800 | $84,000 | $301,800 |
| 2024 | $2,227 | $331,364 | $84,000 | $247,364 |
| 2023 | $7,693 | $331,364 | $84,000 | $247,364 |
| 2022 | $7,514 | $295,428 | $74,000 | $221,428 |
| 2021 | $7,514 | $295,428 | $74,000 | $221,428 |
| 2020 | $7,514 | $295,428 | $74,000 | $221,428 |
| 2019 | $6,920 | $268,284 | $68,000 | $200,284 |
| 2018 | $6,920 | $268,284 | $68,000 | $200,284 |
| 2017 | $6,698 | $268,284 | $68,000 | $200,284 |
| 2016 | $6,710 | $268,284 | $68,000 | $200,284 |
| 2015 | $5,789 | $221,028 | $79,200 | $141,828 |
| 2014 | $5,829 | $221,028 | $0 | $0 |
Source: Public Records
Map
Nearby Homes
- 2082 Kinsmon Dr
- 4599 Lasalle Ct Unit 8A
- 4580 Roswell Rd
- 4255 Green Ridge Dr
- 4804 Dalhousie Place NE
- 4780 Waterhaven Bend
- 2100 Stone Hollow Ct
- 4789 Waterhaven Bend
- 4871 Karls Gate Dr
- 4031 Oak Forest Cir
- 2269 Chimney Springs Dr
- 2249 Smoke Stone Cir
- 4039 Tall Pine Dr
- 2281 Fox Hound Pkwy
- 4586 Hunting Hound Ln
- 1961 Fields Pond Dr
- 3999 Tall Pine Dr
- 4554 Rutherford Dr
- 0 Rutherford Dr Unit 7282587
- 0 Rutherford Dr Unit 7253135
- 0 Rutherford Dr Unit 8651126
- 0 Rutherford Dr Unit 8055713
- 0 Rutherford Dr Unit 8003639
- 0 Rutherford Dr Unit 8386590
- 0 Rutherford Dr Unit 3194454
- 0 Rutherford Dr
- 4558 Rutherford Dr Unit 4A
- 4557 Rutherford Dr Unit 4A
- 4552 Rutherford Dr
- 4559 Rutherford Dr
- 4560 Rutherford Dr Unit 4A
- 4553 Rutherford Dr
- 4551 Rutherford Dr Unit 4A
- 4550 Rutherford Dr Unit 4A
- 0 Kinsmon Dr Unit 8665723
- 0 Kinsmon Dr Unit 8753036
- 0 Kinsmon Dr Unit 3188522