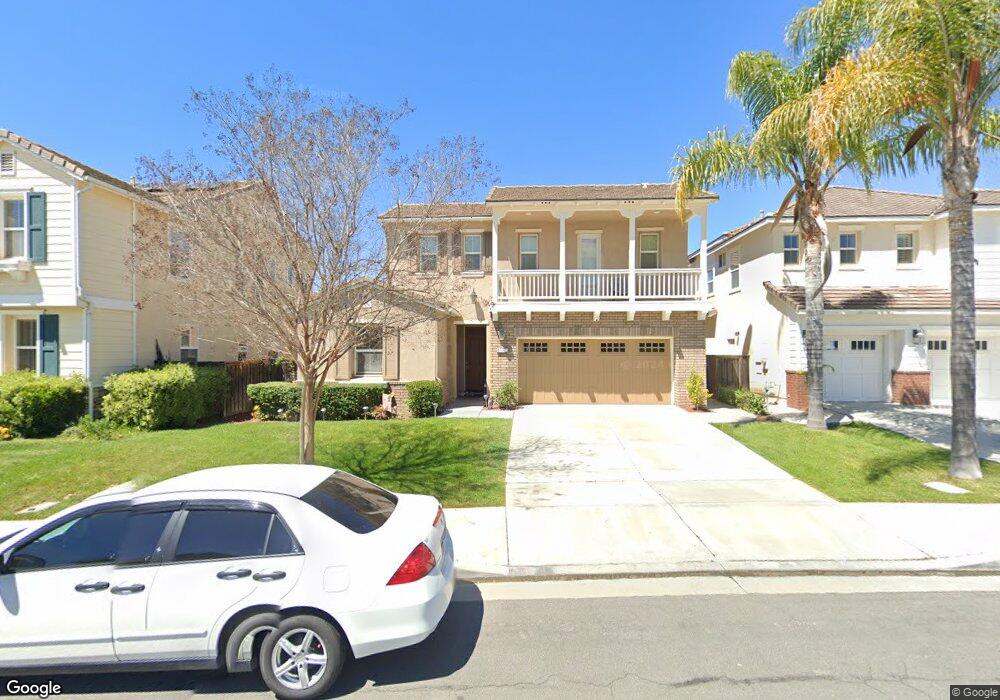
45573 Jaguar Way Temecula, CA 92592
Wolf Creek NeighborhoodEstimated Value: $781,000 - $852,000
4
Beds
4
Baths
2,847
Sq Ft
$286/Sq Ft
Est. Value
About This Home
This home is located at 45573 Jaguar Way, Temecula, CA 92592 and is currently estimated at $813,212, approximately $285 per square foot. 45573 Jaguar Way is a home located in Riverside County with nearby schools including Temecula Luiseno Elementary, Erle Stanley Gardner Middle School, and Great Oak High School.
Ownership History
Date
Name
Owned For
Owner Type
Purchase Details
Closed on
Oct 6, 2020
Sold by
Tang Wei and The Wei Tang Declaration Of Tr
Bought by
Qiu Xiaoyu
Current Estimated Value
Home Financials for this Owner
Home Financials are based on the most recent Mortgage that was taken out on this home.
Original Mortgage
$321,000
Outstanding Balance
$291,450
Interest Rate
4.12%
Mortgage Type
New Conventional
Estimated Equity
$521,762
Purchase Details
Closed on
Nov 22, 2017
Sold by
Tang Wei
Bought by
Tang Wei and Wei Tang Declaration Of Trust
Purchase Details
Closed on
May 19, 2010
Sold by
Alcantara Sylvia S
Bought by
Tang Wei
Purchase Details
Closed on
Oct 19, 2005
Sold by
Continental Residential Inc
Bought by
Alcantara Sylvia S
Home Financials for this Owner
Home Financials are based on the most recent Mortgage that was taken out on this home.
Original Mortgage
$403,583
Interest Rate
5.87%
Mortgage Type
Fannie Mae Freddie Mac
Create a Home Valuation Report for This Property
The Home Valuation Report is an in-depth analysis detailing your home's value as well as a comparison with similar homes in the area
Home Values in the Area
Average Home Value in this Area
Purchase History
| Date | Buyer | Sale Price | Title Company |
|---|---|---|---|
| Qiu Xiaoyu | $535,000 | Wfg National Title Company | |
| Tang Wei | -- | None Available | |
| Tang Wei | $285,000 | Ticor Title | |
| Alcantara Sylvia S | $505,000 | Chicago Title Company |
Source: Public Records
Mortgage History
| Date | Status | Borrower | Loan Amount |
|---|---|---|---|
| Open | Qiu Xiaoyu | $321,000 | |
| Previous Owner | Alcantara Sylvia S | $403,583 |
Source: Public Records
Tax History
| Year | Tax Paid | Tax Assessment Tax Assessment Total Assessment is a certain percentage of the fair market value that is determined by local assessors to be the total taxable value of land and additions on the property. | Land | Improvement |
|---|---|---|---|---|
| 2025 | $8,926 | $579,100 | $135,304 | $443,796 |
| 2023 | $8,926 | $556,614 | $130,050 | $426,564 |
| 2022 | $8,773 | $545,700 | $127,500 | $418,200 |
| 2021 | $8,713 | $535,000 | $125,000 | $410,000 |
| 2020 | $6,502 | $336,371 | $82,614 | $253,757 |
| 2019 | $6,447 | $329,777 | $80,995 | $248,782 |
| 2018 | $6,370 | $323,311 | $79,407 | $243,904 |
| 2017 | $6,292 | $316,972 | $77,850 | $239,122 |
| 2016 | $6,215 | $310,758 | $76,324 | $234,434 |
| 2015 | $6,147 | $306,092 | $75,179 | $230,913 |
| 2014 | $6,029 | $300,098 | $73,707 | $226,391 |
Source: Public Records
Map
Nearby Homes
- 45575 Hawk Ct
- 31868 Corte Montoya
- 31605 Seastar Place
- 45590 Basswood Ct
- 31891 Domenoe Way
- 32046 Corte Montoya
- 31579 Mendocino Ct
- 45733 Sierra Ct
- 45043 Corte Alegra
- 31665 Via Cordoba
- 31598 Six Rivers Ct
- 32153 Caminito Osuna
- 45635 Magnolia Place
- 45808 Klamath Ct
- 31486 Eucalyptus Ct
- 32143 Paseo San Esteban
- 45632 Corte Lobos
- 45971 Hunter Lodge Ln
- 31353 Huron St
- 31330 Eucalyptus Ct
- 45561 Jaguar Way
- 45585 Jaguar Way
- 45554 Hawk Ct
- 45549 Jaguar Way
- 45597 Jaguar Way
- 45542 Hawk Ct
- 45566 Hawk Ct
- 45530 Hawk Ct
- 45578 Hawk Ct
- 45537 Jaguar Way
- 45609 Jaguar Way
- 45518 Hawk Ct
- 45576 Jaguar Way
- 45564 Jaguar Way
- 45588 Jaguar Way
- 45621 Jargar Way
- 45590 Hawk Ct
- 45552 Jaguar Way
- 45600 Jaguar Way
- 45506 Hawk Ct
Your Personal Tour Guide
Ask me questions while you tour the home.