Estimated Value: $440,000 - $457,000
3
Beds
1
Bath
1,604
Sq Ft
$280/Sq Ft
Est. Value
About This Home
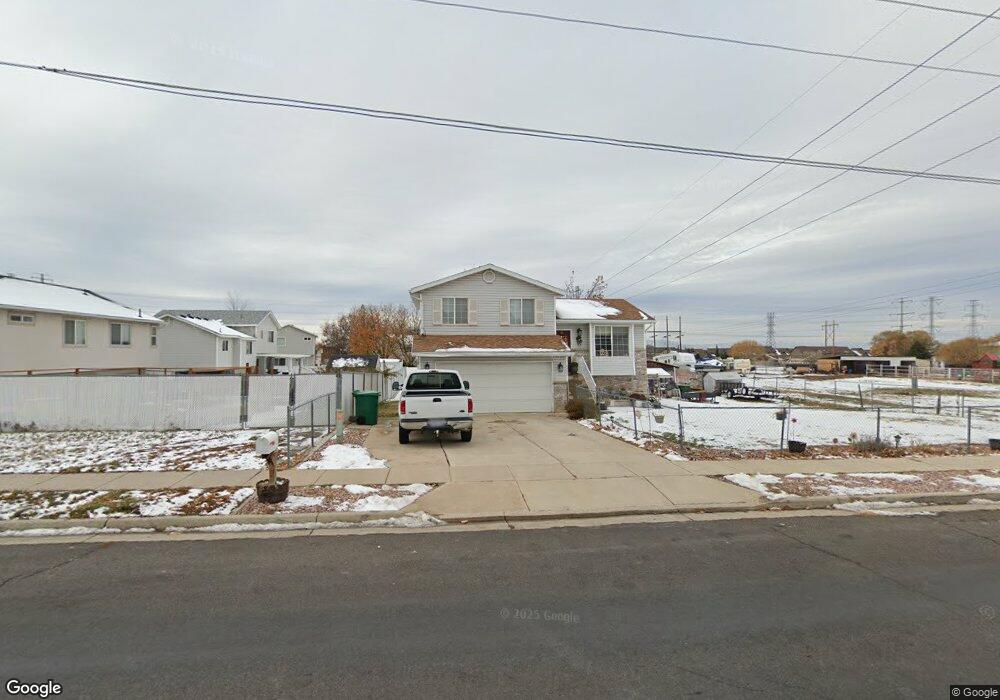
This home is located at 4559 S 3100 W, Roy, UT 84067 and is currently estimated at $448,555, approximately $279 per square foot. 4559 S 3100 W is a home located in Weber County with nearby schools including Midland School, Sand Ridge Junior High School, and Roy High School.
Ownership History
Date
Name
Owned For
Owner Type
Purchase Details
Closed on
Jun 20, 2020
Sold by
Knudson Barbara
Bought by
Knudson Barbara and Berchtold Joseph Todd
Current Estimated Value
Purchase Details
Closed on
Sep 17, 2003
Sold by
Corey Chris K and Corey Melany
Bought by
Wagner Christopher
Home Financials for this Owner
Home Financials are based on the most recent Mortgage that was taken out on this home.
Original Mortgage
$130,491
Outstanding Balance
$60,785
Interest Rate
6.3%
Mortgage Type
FHA
Estimated Equity
$387,771
Purchase Details
Closed on
May 21, 1997
Sold by
Mark Higley Construction Lc
Bought by
Corey Chris K and Corey Melany
Home Financials for this Owner
Home Financials are based on the most recent Mortgage that was taken out on this home.
Original Mortgage
$70,000
Interest Rate
8.14%
Purchase Details
Closed on
Nov 12, 1996
Sold by
Crouch Bruce A
Bought by
Mark Higley Construction Lc
Create a Home Valuation Report for This Property
The Home Valuation Report is an in-depth analysis detailing your home's value as well as a comparison with similar homes in the area
Home Values in the Area
Average Home Value in this Area
Purchase History
| Date | Buyer | Sale Price | Title Company |
|---|---|---|---|
| Knudson Barbara | -- | Us Title Ins Agency | |
| Wagner Christopher | -- | First American Title | |
| Corey Chris K | -- | First American Title | |
| Mark Higley Construction Lc | -- | -- |
Source: Public Records
Mortgage History
| Date | Status | Borrower | Loan Amount |
|---|---|---|---|
| Open | Wagner Christopher | $130,491 | |
| Previous Owner | Corey Chris K | $70,000 |
Source: Public Records
Tax History Compared to Growth
Tax History
| Year | Tax Paid | Tax Assessment Tax Assessment Total Assessment is a certain percentage of the fair market value that is determined by local assessors to be the total taxable value of land and additions on the property. | Land | Improvement |
|---|---|---|---|---|
| 2025 | $2,625 | $412,279 | $154,856 | $257,423 |
| 2024 | $2,567 | $223,299 | $85,170 | $138,129 |
| 2023 | $2,599 | $227,700 | $77,854 | $149,846 |
| 2022 | $2,482 | $222,200 | $65,705 | $156,495 |
| 2021 | $2,190 | $324,000 | $92,008 | $231,992 |
| 2020 | $1,935 | $261,000 | $92,008 | $168,992 |
| 2019 | $1,922 | $245,000 | $55,670 | $189,330 |
| 2018 | $1,819 | $218,000 | $51,232 | $166,768 |
| 2017 | $1,719 | $193,000 | $51,232 | $141,768 |
| 2016 | $1,667 | $100,845 | $26,509 | $74,336 |
| 2015 | $1,455 | $89,182 | $26,509 | $62,673 |
| 2014 | $1,407 | $85,071 | $26,509 | $58,562 |
Source: Public Records
Map
Nearby Homes
- 4635 S 2950 W
- 4510 Stone Creek Rd Unit F
- 3014 W 4750 S
- 4440 Stone Creek Rd Unit 2E
- 3084 W 4375 S
- 4491 Haven Creek Rd Unit A
- 3046 W 4850 S
- 3434 W 4525 S
- 2979 W 4275 S
- 4891 S 2875 W
- 4317 S 3350 W
- 4918 S 2925 W
- 2816 W 4400 S
- 4964 S 3375 W
- 2802 W 4375 S
- 5009 S 2925 W
- 3509 W 4835 S Unit 26
- 5003 S 2825 W
- 3524 W 4835 S Unit 22
- 2835 W 4200 S