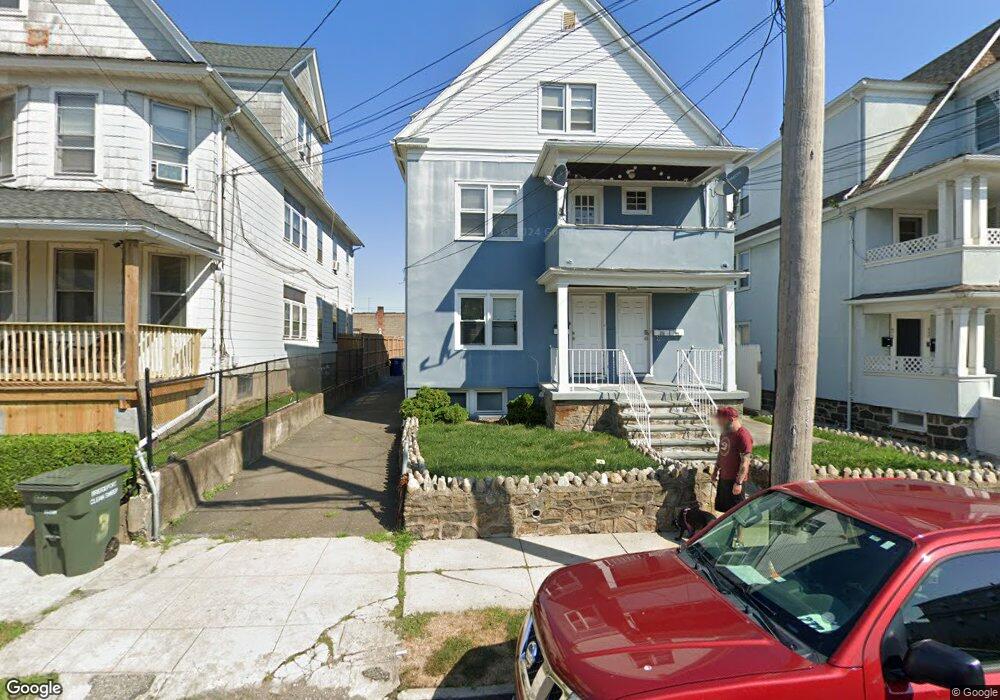
456-460 Charles St Bridge Port, CT 06606
Brooklawn-Saint Vincent NeighborhoodEstimated Value: $662,000 - $831,000
6
Beds
3
Baths
2,860
Sq Ft
$257/Sq Ft
Est. Value
About This Home
This home is located at 456-460 Charles St, Bridge Port, CT 06606 and is currently estimated at $736,266, approximately $257 per square foot. 456-460 Charles St is a home located in Fairfield County with nearby schools including Read School, Central High School, and Catholic Academy of Bridgeport-St. Raphael Academy.
Ownership History
Date
Name
Owned For
Owner Type
Purchase Details
Closed on
Jul 24, 2024
Sold by
Corodova Ivan
Bought by
Guaman Luis L and Granda Maria M
Current Estimated Value
Home Financials for this Owner
Home Financials are based on the most recent Mortgage that was taken out on this home.
Original Mortgage
$524,000
Outstanding Balance
$517,596
Interest Rate
6.87%
Mortgage Type
Purchase Money Mortgage
Estimated Equity
$218,670
Purchase Details
Closed on
Jan 19, 2018
Sold by
Fnma
Bought by
Rodriguez Ivan
Home Financials for this Owner
Home Financials are based on the most recent Mortgage that was taken out on this home.
Original Mortgage
$281,734
Interest Rate
3.94%
Mortgage Type
FHA
Create a Home Valuation Report for This Property
The Home Valuation Report is an in-depth analysis detailing your home's value as well as a comparison with similar homes in the area
Home Values in the Area
Average Home Value in this Area
Purchase History
| Date | Buyer | Sale Price | Title Company |
|---|---|---|---|
| Guaman Luis L | $655,000 | None Available | |
| Guaman Luis L | $655,000 | None Available | |
| Guaman Luis L | $655,000 | None Available | |
| Rodriguez Ivan | $240,000 | -- | |
| Rodriguez Ivan | $240,000 | -- |
Source: Public Records
Mortgage History
| Date | Status | Borrower | Loan Amount |
|---|---|---|---|
| Open | Guaman Luis L | $524,000 | |
| Closed | Guaman Luis L | $524,000 | |
| Previous Owner | Rodriguez Ivan | $281,734 |
Source: Public Records
Tax History Compared to Growth
Tax History
| Year | Tax Paid | Tax Assessment Tax Assessment Total Assessment is a certain percentage of the fair market value that is determined by local assessors to be the total taxable value of land and additions on the property. | Land | Improvement |
|---|---|---|---|---|
| 2025 | $9,158 | $210,780 | $71,240 | $139,540 |
| 2024 | $8,669 | $199,510 | $71,240 | $128,270 |
| 2023 | $8,669 | $199,510 | $71,240 | $128,270 |
| 2022 | $8,669 | $199,510 | $71,240 | $128,270 |
| 2021 | $8,669 | $199,510 | $71,240 | $128,270 |
| 2020 | $8,218 | $152,210 | $43,160 | $109,050 |
| 2019 | $8,218 | $152,210 | $43,160 | $109,050 |
| 2018 | $8,276 | $152,210 | $43,160 | $109,050 |
| 2017 | $8,276 | $152,210 | $43,160 | $109,050 |
| 2016 | $8,276 | $152,210 | $43,160 | $109,050 |
| 2015 | $8,025 | $190,160 | $43,530 | $146,630 |
| 2014 | $8,025 | $190,160 | $43,530 | $146,630 |
Source: Public Records
Map
Nearby Homes
- 31 Taft Ave
- 390 Charles St Unit 106
- 724 Capitol Ave Unit 726
- 119 Madison Terrace
- 78 Fairmount Ave
- 90 Tom Thumb St
- 2395 Main St Unit 2397
- 356 Taft Ave
- 76 Porter St
- 201 High Ridge Dr
- 1275 Capitol Ave
- 191 Oak St
- 508 Hawley Ave
- 2345 Park Ave
- 100 Lorraine St
- 330 French St
- 125 Alexander Dr
- 241 Sampson St
- 150 Alexander Dr
- 318 Center St
- 448-452 Charles St
- 432 Charles St Unit 434
- 466 Charles St
- 448 Charles St Unit 452
- 448 Charles St Unit 3rd flr
- 418 Charles St
- 476 Charles St
- 456 Charles St Unit 460
- 456 Charles St Unit Second floor
- 466 Charles St
- 439 Charles St Unit 443
- 451 Charles St
- 279 Federal St
- 269 Federal St
- 474 Charles St
- 459 Charles St
- 439-443 Charles St
- 425 Charles St
- 404 Charles St Unit B3
- 404 Charles St Unit C2