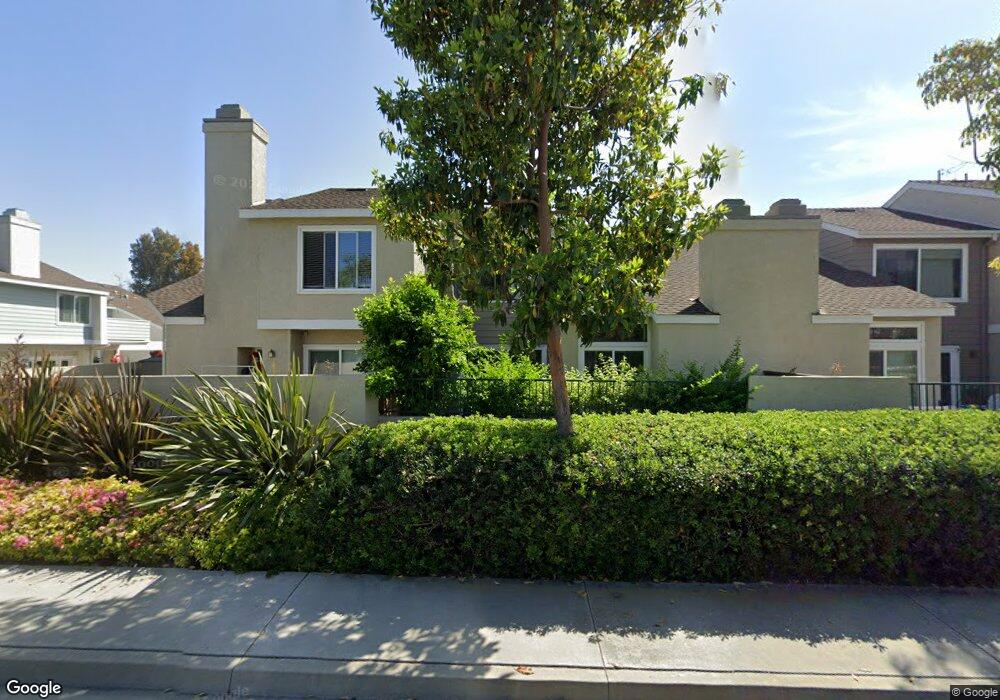
456 Deerfield Ave Unit 160 Irvine, CA 92606
Walnut NeighborhoodEstimated Value: $924,445 - $982,000
2
Beds
3
Baths
1,297
Sq Ft
$729/Sq Ft
Est. Value
About This Home
This home is located at 456 Deerfield Ave Unit 160, Irvine, CA 92606 and is currently estimated at $945,361, approximately $728 per square foot. 456 Deerfield Ave Unit 160 is a home located in Orange County with nearby schools including Deerfield Elementary School, Venado Middle School, and Irvine High School.
Ownership History
Date
Name
Owned For
Owner Type
Purchase Details
Closed on
Jun 15, 2012
Sold by
Watters Lourdes E
Bought by
Watters Lourdes E and The Celou Trust
Current Estimated Value
Purchase Details
Closed on
May 19, 2006
Sold by
Watters David W and Watters Lourdes E
Bought by
Watters Lourdes E
Home Financials for this Owner
Home Financials are based on the most recent Mortgage that was taken out on this home.
Original Mortgage
$61,660
Interest Rate
6.46%
Mortgage Type
New Conventional
Purchase Details
Closed on
Jul 12, 2001
Sold by
Watters Dave and Watters Lourdes
Bought by
Watters David W and Watters Lourdes E
Purchase Details
Closed on
Aug 18, 1999
Sold by
Koobie Loreen 2 and Arthur
Bought by
Watters Dave and Watters Lourdes
Home Financials for this Owner
Home Financials are based on the most recent Mortgage that was taken out on this home.
Original Mortgage
$191,900
Outstanding Balance
$67,405
Interest Rate
10.5%
Estimated Equity
$877,956
Create a Home Valuation Report for This Property
The Home Valuation Report is an in-depth analysis detailing your home's value as well as a comparison with similar homes in the area
Home Values in the Area
Average Home Value in this Area
Purchase History
| Date | Buyer | Sale Price | Title Company |
|---|---|---|---|
| Watters Lourdes E | -- | None Available | |
| Watters Lourdes E | -- | First American Title Co | |
| Watters David W | -- | South Coast Title | |
| Watters Dave | $202,000 | First Southwestern Title Co |
Source: Public Records
Mortgage History
| Date | Status | Borrower | Loan Amount |
|---|---|---|---|
| Closed | Watters Lourdes E | $61,660 | |
| Open | Watters Dave | $191,900 |
Source: Public Records
Tax History Compared to Growth
Tax History
| Year | Tax Paid | Tax Assessment Tax Assessment Total Assessment is a certain percentage of the fair market value that is determined by local assessors to be the total taxable value of land and additions on the property. | Land | Improvement |
|---|---|---|---|---|
| 2025 | $3,312 | $310,460 | $169,589 | $140,871 |
| 2024 | $3,312 | $304,373 | $166,264 | $138,109 |
| 2023 | $3,225 | $298,405 | $163,004 | $135,401 |
| 2022 | $3,158 | $292,554 | $159,807 | $132,747 |
| 2021 | $3,082 | $286,818 | $156,673 | $130,145 |
| 2020 | $3,064 | $283,878 | $155,067 | $128,811 |
| 2019 | $2,995 | $278,312 | $152,026 | $126,286 |
| 2018 | $2,939 | $272,855 | $149,045 | $123,810 |
| 2017 | $2,877 | $267,505 | $146,122 | $121,383 |
| 2016 | $2,753 | $262,260 | $143,257 | $119,003 |
| 2015 | $2,712 | $258,321 | $141,105 | $117,216 |
| 2014 | $2,659 | $253,261 | $138,341 | $114,920 |
Source: Public Records
Map
Nearby Homes
- 43 Riverstone
- 424 Deerfield Ave Unit 172
- 369 Deerfield Ave Unit 35
- 3621 Myrtle St
- 3852 Blackthorn St
- 311 Nimbus Dr
- 264 Blue Sky Dr Unit 264
- 3871 Banyan St
- 11 Pienza
- 4 Wintergreen Unit 4
- 4071 Loma St
- 14561 Linden Ave
- 32 Goldenbush
- 3852 Uris Ct
- 14375 Majorca Ave
- 35 Del Cambrea
- 261 Barnes Rd
- 61 Windwalker Way
- 12 Oakdale
- 20 Nevada
- 435 Deerfield Ave Unit 129
- 433 Deerfield Ave Unit 128
- 437 Deerfield Ave Unit 130
- 439 Deerfield Ave
- 458 Deerfield Ave
- 443 Deerfield Ave Unit 133
- 454 Deerfield Ave Unit 161
- 445 Deerfield Ave
- 447 Deerfield Ave Unit 135
- 447 Deerfield Ave Unit 19
- 449 Deerfield Ave
- 447 Deerfield Ave
- 453 Deerfield Ave Unit 138
- 455 Deerfield Ave Unit 139
- 455 Deerfield Ave
- 408 Deerfield Ave
- 404 Deerfield Ave
- 462 Deerfield Ave Unit 157
- 460 Deerfield Ave
- 462 Deerfield Ave