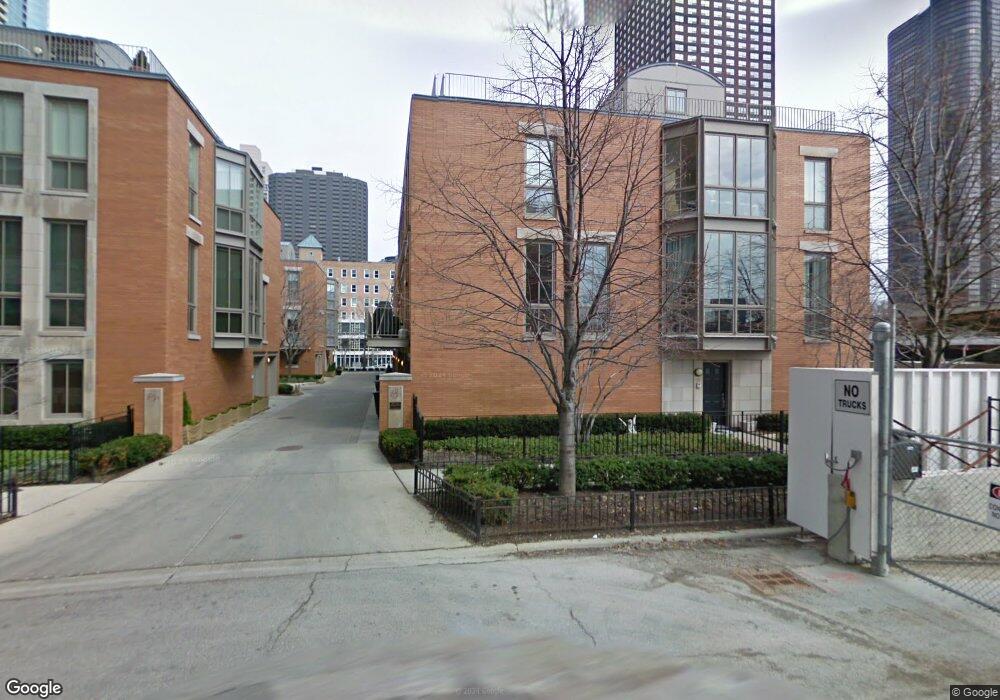
456 E North Water St Unit G Chicago, IL 60611
Streeterville NeighborhoodEstimated Value: $1,333,000 - $2,462,000
4
Beds
4
Baths
3,740
Sq Ft
$477/Sq Ft
Est. Value
About This Home
This home is located at 456 E North Water St Unit G, Chicago, IL 60611 and is currently estimated at $1,785,267, approximately $477 per square foot. 456 E North Water St Unit G is a home located in Cook County with nearby schools including Ogden Elementary School, Wells Community Academy High School, and Chicago International Charter School.
Ownership History
Date
Name
Owned For
Owner Type
Purchase Details
Closed on
Jul 20, 2017
Sold by
Tassone Bruno J and Tassone Cheryl A
Bought by
Hassan Chandra and Hassan Sobia
Current Estimated Value
Home Financials for this Owner
Home Financials are based on the most recent Mortgage that was taken out on this home.
Original Mortgage
$1,246,500
Outstanding Balance
$1,016,891
Interest Rate
3.25%
Mortgage Type
Adjustable Rate Mortgage/ARM
Estimated Equity
$768,376
Purchase Details
Closed on
Oct 1, 2007
Sold by
Cdct Land Co Llc
Bought by
Tassone Bruno J and Tassone Cheryl A
Purchase Details
Closed on
Sep 19, 1997
Sold by
East Water Place Lp
Bought by
Tassone Bruno J and Tassone Cheryl A
Create a Home Valuation Report for This Property
The Home Valuation Report is an in-depth analysis detailing your home's value as well as a comparison with similar homes in the area
Home Values in the Area
Average Home Value in this Area
Purchase History
| Date | Buyer | Sale Price | Title Company |
|---|---|---|---|
| Hassan Chandra | $1,385,000 | Freedom Title Corporation | |
| Tassone Bruno J | $294,000 | None Available | |
| Tassone Bruno J | $312,000 | -- |
Source: Public Records
Mortgage History
| Date | Status | Borrower | Loan Amount |
|---|---|---|---|
| Open | Hassan Chandra | $1,246,500 |
Source: Public Records
Tax History Compared to Growth
Tax History
| Year | Tax Paid | Tax Assessment Tax Assessment Total Assessment is a certain percentage of the fair market value that is determined by local assessors to be the total taxable value of land and additions on the property. | Land | Improvement |
|---|---|---|---|---|
| 2024 | $26,163 | $150,000 | $26,496 | $123,504 |
| 2023 | $25,504 | $124,001 | $21,368 | $102,633 |
| 2022 | $25,504 | $124,001 | $21,368 | $102,633 |
| 2021 | $24,935 | $123,999 | $21,367 | $102,632 |
| 2020 | $27,126 | $121,766 | $16,483 | $105,283 |
| 2019 | $26,592 | $132,355 | $16,483 | $115,872 |
| 2018 | $26,145 | $132,355 | $16,483 | $115,872 |
| 2017 | $22,321 | $109,762 | $14,041 | $95,721 |
| 2016 | $21,984 | $109,762 | $14,041 | $95,721 |
| 2015 | $19,289 | $109,762 | $14,041 | $95,721 |
| 2014 | $14,498 | $82,542 | $11,599 | $70,943 |
| 2013 | $14,192 | $82,542 | $11,599 | $70,943 |
Source: Public Records
Map
Nearby Homes
- 474 N Lake Shore Dr Unit 5407
- 474 N Lake Shore Dr Unit 5008
- 474 N Lake Shore Dr Unit PS048
- 474 N Lake Shore Dr Unit 6102
- 474 N Lake Shore Dr Unit 4003
- 474 N Lake Shore Dr Unit 2408
- 474 N Lake Shore Dr Unit 3309
- 474 N Lake Shore Dr Unit 2301
- 474 N Lake Shore Dr Unit 5403
- 474 N Lake Shore Dr Unit 4607
- 474 N Lake Shore Dr Unit 2904
- 474 N Lake Shore Dr Unit P-367
- 474 N Lake Shore Dr Unit PS173
- 474 N Lake Shore Dr Unit PS286
- 474 N Lake Shore Dr Unit 4806
- 474 N Lake Shore Dr Unit 2801
- 474 N Lake Shore Dr Unit 3203
- 474 N Lake Shore Dr Unit 2101
- 474 N Lake Shore Dr Unit 3108
- 474 N Lake Shore Dr Unit 2407
- 456 E North Water St Unit F
- 456 E North Water St
- 456 E North Water St
- 456 E North Water St
- 456 E North Water St
- 456 E North Water St
- 456 E North Water St
- 456 E North Water St
- 456 E North Water St
- 456 E North Water St Unit B
- 456 E North Water St Unit E
- 456 E North Water St Unit A
- 436 E North Water St Unit F
- 436 E North Water St
- 436 E North Water St
- 436 E North Water St
- 436 E North Water St
- 436 E North Water St
- 436 E North Water St
- 436 E North Water St Unit 6204