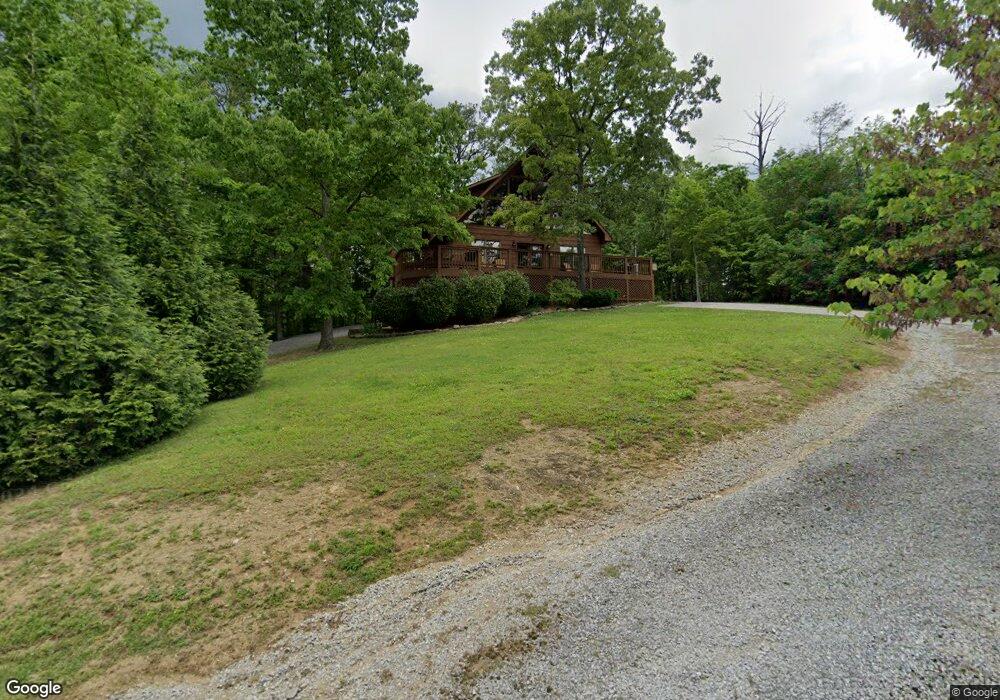
456 Laurel Valley Rd Townsend, TN 37882
Estimated Value: $485,115 - $674,000
3
Beds
2
Baths
1,536
Sq Ft
$367/Sq Ft
Est. Value
About This Home
This home is located at 456 Laurel Valley Rd, Townsend, TN 37882 and is currently estimated at $563,279, approximately $366 per square foot. 456 Laurel Valley Rd is a home located in Blount County with nearby schools including Townsend Elementary School, Heritage Middle School, and Heritage High School.
Ownership History
Date
Name
Owned For
Owner Type
Purchase Details
Closed on
Aug 16, 2011
Sold by
Greenwood Thomas G
Bought by
Harper Cynthia P
Current Estimated Value
Home Financials for this Owner
Home Financials are based on the most recent Mortgage that was taken out on this home.
Original Mortgage
$243,000
Outstanding Balance
$167,335
Interest Rate
4.53%
Mortgage Type
Commercial
Estimated Equity
$395,944
Purchase Details
Closed on
Jan 7, 2003
Bought by
Greenwood Thomas G and Greenwood Melissa M
Purchase Details
Closed on
Mar 16, 2001
Sold by
Hmielewski David
Bought by
Hmielewski Kathleen
Purchase Details
Closed on
Apr 22, 1998
Bought by
Hmielewski David C
Purchase Details
Closed on
Nov 12, 1976
Bought by
Sullivan Jerry A and Sullivan Betty C
Create a Home Valuation Report for This Property
The Home Valuation Report is an in-depth analysis detailing your home's value as well as a comparison with similar homes in the area
Home Values in the Area
Average Home Value in this Area
Purchase History
| Date | Buyer | Sale Price | Title Company |
|---|---|---|---|
| Harper Cynthia P | $310,000 | -- | |
| Greenwood Thomas G | $243,000 | -- | |
| Hmielewski Kathleen | $172,000 | -- | |
| Hmielewski David C | $25,000 | -- | |
| Sullivan Jerry A | -- | -- |
Source: Public Records
Mortgage History
| Date | Status | Borrower | Loan Amount |
|---|---|---|---|
| Open | Harper Cynthia P | $243,000 |
Source: Public Records
Tax History
| Year | Tax Paid | Tax Assessment Tax Assessment Total Assessment is a certain percentage of the fair market value that is determined by local assessors to be the total taxable value of land and additions on the property. | Land | Improvement |
|---|---|---|---|---|
| 2025 | $1,397 | $87,875 | $15,625 | $72,250 |
| 2024 | $1,397 | $87,875 | $15,625 | $72,250 |
| 2023 | $1,397 | $87,875 | $15,625 | $72,250 |
| 2022 | $1,541 | $62,400 | $15,000 | $47,400 |
| 2021 | $1,541 | $62,400 | $15,000 | $47,400 |
| 2020 | $1,541 | $62,400 | $15,000 | $47,400 |
| 2019 | $1,541 | $62,400 | $15,000 | $47,400 |
| 2018 | $1,651 | $66,850 | $21,875 | $44,975 |
| 2017 | $1,651 | $66,850 | $21,875 | $44,975 |
| 2016 | $1,651 | $66,850 | $21,875 | $44,975 |
| 2015 | $1,437 | $66,850 | $21,875 | $44,975 |
| 2014 | $1,443 | $66,850 | $21,875 | $44,975 |
| 2013 | $1,443 | $67,125 | $0 | $0 |
Source: Public Records
Map
Nearby Homes
- 0 Laurel Rd
- 00 Laurel Rd
- 124 Cutter Gap Rd
- 129 Cutter Gap Rd
- 1148 Laurel Rd
- 219 Tolliver Trail
- 228 Tolliver Trail
- 731 Hunters Run Rd
- 218 Ace Gap Rd
- 0 Ace Gap Rd Unit 1325220
- 134 Fairway Cir
- 413 Settlers Rise Rd
- 1005 Laurel Rd
- 438 Kurts Corner Rd
- 316 Laurel Rd
- 407 Kurts Corner Rd
- 106 Fairway Cir
- 386 Laurel Rd
- 194 Cold Springs Trace
- 517 Clearwater Cir
- Tbd Laurel Valley Rd
- 448 Laurel Valley Rd
- 466 Laurel Valley Rd
- 509 Reeds Way
- 490 Laurel Valley Rd
- 501 Reeds Way
- 480 Laurel Valley Rd
- 0 Reeds Way Unit 931314
- 476 Laurel Valley Rd
- 517 Reeds Way
- 364 Laurel Valley Rd
- Lot 65 Tolliver Tr
- 0 Tolliver Lot 32 Tr Unit 1068009
- 62 Tolliver Trail
- 39 Tolliver Trail
- 38 Tolliver Trail
- 65 Tolliver Trail
- 525 Reeds Way
- 525 Springside Way
- T B D Laurel Rd
Your Personal Tour Guide
Ask me questions while you tour the home.