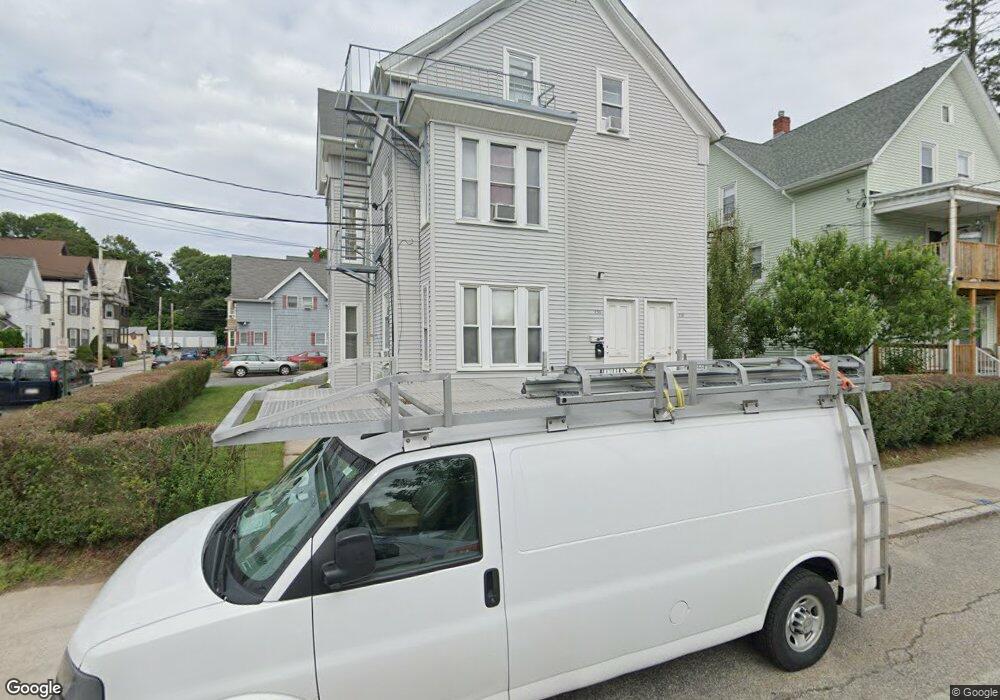
456 N Main St Woonsocket, RI 02895
North End NeighborhoodEstimated Value: $408,928 - $587,000
6
Beds
3
Baths
3,427
Sq Ft
$156/Sq Ft
Est. Value
About This Home
This home is located at 456 N Main St, Woonsocket, RI 02895 and is currently estimated at $535,732, approximately $156 per square foot. 456 N Main St is a home located in Providence County with nearby schools including Woonsocket High School, Rise Prep Mayoral Academy Middle School, and Rise Prep Mayoral Academy.
Ownership History
Date
Name
Owned For
Owner Type
Purchase Details
Closed on
Nov 17, 2003
Sold by
Wade 3Rd Ira G and Wade Melody J
Bought by
Berroa Martin Abreau and Henriguez Eulalia
Current Estimated Value
Home Financials for this Owner
Home Financials are based on the most recent Mortgage that was taken out on this home.
Original Mortgage
$183,350
Outstanding Balance
$83,207
Interest Rate
5.81%
Mortgage Type
Purchase Money Mortgage
Estimated Equity
$452,525
Purchase Details
Closed on
Aug 25, 1997
Sold by
Coffey C Dorothy Est
Bought by
Wade Ira G and Wade Melody
Home Financials for this Owner
Home Financials are based on the most recent Mortgage that was taken out on this home.
Original Mortgage
$71,850
Interest Rate
7.42%
Mortgage Type
Purchase Money Mortgage
Create a Home Valuation Report for This Property
The Home Valuation Report is an in-depth analysis detailing your home's value as well as a comparison with similar homes in the area
Home Values in the Area
Average Home Value in this Area
Purchase History
| Date | Buyer | Sale Price | Title Company |
|---|---|---|---|
| Berroa Martin Abreau | $193,000 | -- | |
| Berroa Martin Abreau | $193,000 | -- | |
| Wade Ira G | $72,000 | -- | |
| Wade Ira G | $72,000 | -- |
Source: Public Records
Mortgage History
| Date | Status | Borrower | Loan Amount |
|---|---|---|---|
| Open | Wade Ira G | $183,350 | |
| Closed | Wade Ira G | $183,350 | |
| Previous Owner | Wade Ira G | $47,600 | |
| Previous Owner | Wade Ira G | $71,850 |
Source: Public Records
Tax History
| Year | Tax Paid | Tax Assessment Tax Assessment Total Assessment is a certain percentage of the fair market value that is determined by local assessors to be the total taxable value of land and additions on the property. | Land | Improvement |
|---|---|---|---|---|
| 2025 | $6,156 | $548,200 | $89,600 | $458,600 |
| 2024 | $5,010 | $344,600 | $91,200 | $253,400 |
| 2023 | $4,818 | $344,600 | $91,200 | $253,400 |
| 2022 | $4,818 | $344,600 | $91,200 | $253,400 |
| 2021 | $4,028 | $169,600 | $37,200 | $132,400 |
| 2020 | $4,070 | $169,600 | $37,200 | $132,400 |
| 2018 | $4,077 | $169,300 | $37,200 | $132,100 |
| 2017 | $4,512 | $149,900 | $40,700 | $109,200 |
| 2016 | $4,773 | $149,900 | $40,700 | $109,200 |
| 2015 | $5,483 | $149,900 | $40,700 | $109,200 |
| 2014 | $5,254 | $146,200 | $44,800 | $101,400 |
Source: Public Records
Map
Nearby Homes
- 83 Summer St
- 130 E School St
- 589 Gaskill St
- 458 Prospect St
- 154 156 Winter St
- 542 Prospect St
- 0 N Main St Unit 1401765
- 58 Oakley Rd
- 56 Winter St
- 256 Privilege St
- 308 Harris Ave
- 115 Railroad St
- 42 Elbow St
- 60 Rathbun St
- 60 Fairlawn Ave
- 752 Social St
- 180 Allen St Unit 104
- 40 Valley St
- 10 Huntington Ave
- 36 Fairmount St
Your Personal Tour Guide
Ask me questions while you tour the home.