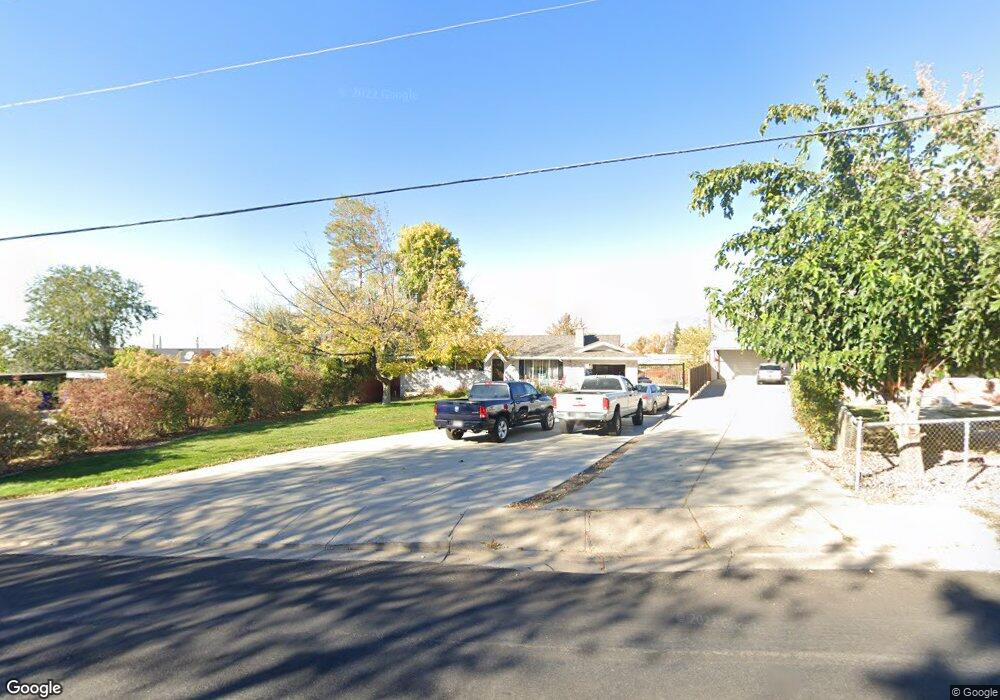
456 W 3100 S Bountiful, UT 84010
Estimated Value: $510,000 - $613,000
5
Beds
3
Baths
2,214
Sq Ft
$254/Sq Ft
Est. Value
About This Home
This home is located at 456 W 3100 S, Bountiful, UT 84010 and is currently estimated at $563,384, approximately $254 per square foot. 456 W 3100 S is a home located in Davis County with nearby schools including Boulton School, South Davis Junior High School, and Woods Cross High School.
Ownership History
Date
Name
Owned For
Owner Type
Purchase Details
Closed on
Mar 16, 2007
Sold by
Davis Ryan
Bought by
Davis Ryan and Davis Stacey
Current Estimated Value
Home Financials for this Owner
Home Financials are based on the most recent Mortgage that was taken out on this home.
Original Mortgage
$180,000
Outstanding Balance
$108,708
Interest Rate
6.31%
Mortgage Type
New Conventional
Estimated Equity
$454,676
Purchase Details
Closed on
Oct 3, 2005
Sold by
Quilter Karl C and Quilter Sherrie L
Bought by
Davis Ryan
Home Financials for this Owner
Home Financials are based on the most recent Mortgage that was taken out on this home.
Original Mortgage
$128,400
Interest Rate
5.7%
Mortgage Type
Fannie Mae Freddie Mac
Purchase Details
Closed on
Dec 4, 1998
Sold by
Mock Donna S
Bought by
Quilter Karl C and Quilter Sherrie L
Home Financials for this Owner
Home Financials are based on the most recent Mortgage that was taken out on this home.
Original Mortgage
$109,600
Interest Rate
6.78%
Create a Home Valuation Report for This Property
The Home Valuation Report is an in-depth analysis detailing your home's value as well as a comparison with similar homes in the area
Home Values in the Area
Average Home Value in this Area
Purchase History
| Date | Buyer | Sale Price | Title Company |
|---|---|---|---|
| Davis Ryan | -- | Advanced Title Ins Ag Slc | |
| Davis Ryan | -- | Advanced Title Ins Agency Sl | |
| Quilter Karl C | -- | Equity Title Agency |
Source: Public Records
Mortgage History
| Date | Status | Borrower | Loan Amount |
|---|---|---|---|
| Open | Davis Ryan | $180,000 | |
| Closed | Davis Ryan | $128,400 | |
| Previous Owner | Quilter Karl C | $109,600 |
Source: Public Records
Tax History Compared to Growth
Tax History
| Year | Tax Paid | Tax Assessment Tax Assessment Total Assessment is a certain percentage of the fair market value that is determined by local assessors to be the total taxable value of land and additions on the property. | Land | Improvement |
|---|---|---|---|---|
| 2025 | $3,294 | $298,650 | $165,355 | $133,295 |
| 2024 | $3,116 | $287,100 | $159,119 | $127,981 |
| 2023 | $3,010 | $500,000 | $281,981 | $218,019 |
| 2022 | $3,133 | $292,050 | $151,161 | $140,889 |
| 2021 | $2,692 | $383,000 | $198,273 | $184,727 |
| 2020 | $2,368 | $337,000 | $165,481 | $171,519 |
| 2019 | $2,252 | $316,000 | $150,481 | $165,519 |
| 2018 | $2,088 | $288,000 | $146,994 | $141,006 |
| 2016 | $1,339 | $107,030 | $60,725 | $46,305 |
| 2015 | $1,307 | $98,780 | $60,725 | $38,055 |
| 2014 | $1,227 | $94,820 | $60,725 | $34,095 |
| 2013 | -- | $112,903 | $39,727 | $73,176 |
Source: Public Records
Map
Nearby Homes
- 527 Applewood Dr
- 3183 S 500 W
- 2943 S 400 W
- 3238 S 675 W
- 117 W 3000 S
- 757 W 3200 S
- 310 N 675 E
- 8 E 3500 S
- 3463 S 50 E
- 1036 E Fairway Dr
- 298 Percival St Unit 354
- 1104 E Fairway Dr
- 3474 S 100 E
- 626 Sagramore St
- 259 Lionel St Unit 373
- 785 Percival St
- 3716 S Oakridge Cir
- 638 Scenic Hills Dr
- 246 Galahad St
- 178 N Valley View Dr
- 446 W 3100 S
- 3047 Orchard Dr Unit D
- 3047 Orchard Dr Unit C
- 3047 Orchard Dr Unit B
- 3047 Orchard Dr Unit A
- 3047 Orchard Dr Unit 3B
- 3047 Orchard Dr
- 3047 Orchard Dr Unit 3D
- 3047 Orchard Dr Unit 3A
- 3049 Orchard Dr Unit D
- 3049 Orchard Dr Unit C
- 3049 Orchard Dr Unit B
- 3049 Orchard Dr Unit A
- 3049 S Orchard Dr
- 3049 S Orchard Dr Unit 4C
- 3049 S Orchard Dr Unit C
- 3049 Orchard Dr Unit 4D
- 3049 S Orchard Dr Unit B-4
- 3049 Orchard Dr Unit 4C
- 3049 Orchard Dr