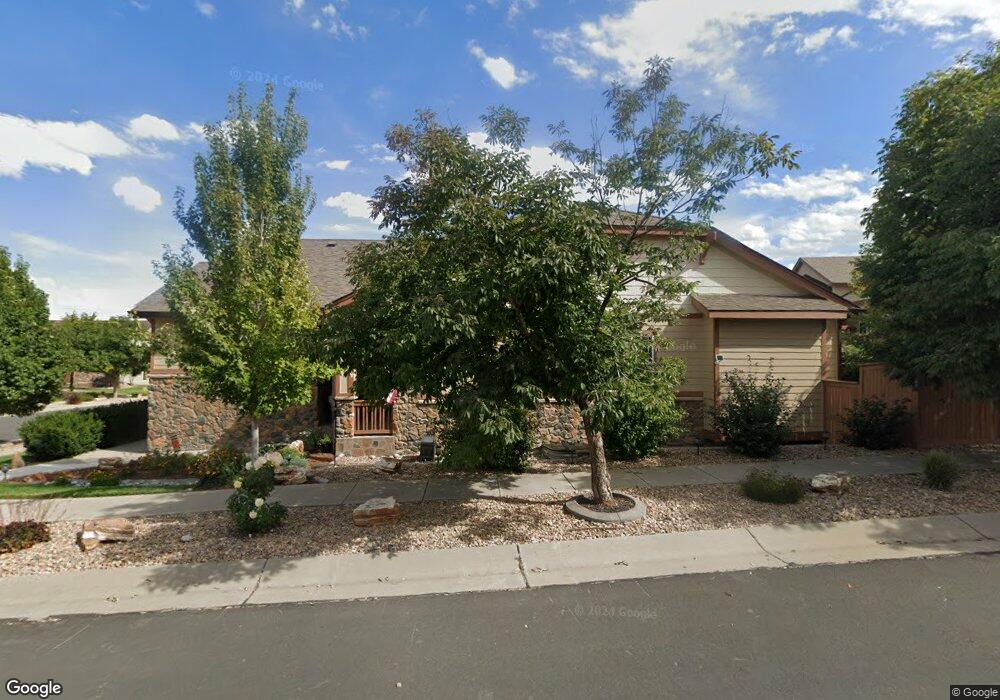
4560 Haystack Ln Brighton, CO 80601
Estimated Value: $554,000 - $643,000
3
Beds
2
Baths
2,204
Sq Ft
$273/Sq Ft
Est. Value
About This Home
This home is located at 4560 Haystack Ln, Brighton, CO 80601 and is currently estimated at $602,042, approximately $273 per square foot. 4560 Haystack Ln is a home located in Adams County with nearby schools including Northeast Elementary School, Overland Trail Middle School, and Brighton High School.
Ownership History
Date
Name
Owned For
Owner Type
Purchase Details
Closed on
Jan 10, 2012
Sold by
Wolf Valerie L
Bought by
Wolf Valerie L and Wolf Dennis J
Current Estimated Value
Purchase Details
Closed on
Sep 9, 2011
Sold by
Wolf Dennis J and Wolf Valerie J
Bought by
Wolf Valerie L
Home Financials for this Owner
Home Financials are based on the most recent Mortgage that was taken out on this home.
Original Mortgage
$480,000
Outstanding Balance
$326,576
Interest Rate
4.43%
Mortgage Type
Reverse Mortgage Home Equity Conversion Mortgage
Estimated Equity
$275,466
Purchase Details
Closed on
Sep 15, 2006
Sold by
Lennar Colorado Llc
Bought by
Wolf Dennis J and Wolf Valerie L
Home Financials for this Owner
Home Financials are based on the most recent Mortgage that was taken out on this home.
Original Mortgage
$150,000
Interest Rate
6.51%
Mortgage Type
Unknown
Create a Home Valuation Report for This Property
The Home Valuation Report is an in-depth analysis detailing your home's value as well as a comparison with similar homes in the area
Home Values in the Area
Average Home Value in this Area
Purchase History
| Date | Buyer | Sale Price | Title Company |
|---|---|---|---|
| Wolf Valerie L | -- | None Available | |
| Wolf Valerie L | -- | None Available | |
| Wolf Dennis J | $295,000 | North American Title |
Source: Public Records
Mortgage History
| Date | Status | Borrower | Loan Amount |
|---|---|---|---|
| Open | Wolf Valerie L | $480,000 | |
| Closed | Wolf Dennis J | $150,000 |
Source: Public Records
Tax History
| Year | Tax Paid | Tax Assessment Tax Assessment Total Assessment is a certain percentage of the fair market value that is determined by local assessors to be the total taxable value of land and additions on the property. | Land | Improvement |
|---|---|---|---|---|
| 2025 | $5,434 | $41,820 | $7,820 | $34,000 |
| 2024 | $5,434 | $38,440 | $7,190 | $31,250 |
| 2023 | $5,430 | $43,300 | $7,780 | $35,520 |
| 2022 | $4,339 | $32,640 | $8,270 | $24,370 |
| 2021 | $4,244 | $32,640 | $8,270 | $24,370 |
| 2020 | $4,088 | $31,990 | $8,510 | $23,480 |
| 2019 | $4,302 | $31,990 | $8,510 | $23,480 |
| 2018 | $3,576 | $26,380 | $6,840 | $19,540 |
| 2017 | $3,579 | $26,380 | $6,840 | $19,540 |
| 2016 | $4,480 | $23,940 | $5,090 | $18,850 |
| 2015 | $4,464 | $23,940 | $5,090 | $18,850 |
| 2014 | -- | $21,430 | $4,620 | $16,810 |
Source: Public Records
Map
Nearby Homes
- 515 Daylight Ct
- 531 Horseshoe Place
- 608 Hayloft Way
- 512 Tumbleweed Dr
- 4645 Longs Peak St
- 4634 Longs Peak St
- 4716 Dewey Ln
- 480 Hayloft Way
- 4751 Ambrose Place
- 461 Azalea St
- 4702 Thistle Dr
- 256 Homestead Way
- 2179 Fletcher Ave
- 4495 Windmill Dr
- 518 Draw St
- 5230 Silver Maple St
- 4256 Windmill Dr
- 5173 Longs Peak St
- 4277 Prairie Dr
- 4231 Prairie Dr
- 4580 Haystack Ln
- 4571 Tumbleweed Dr
- 4513 Haystack Ln
- 4563 Haystack Ln
- 4503 Haystack Ln
- 4553 Haystack Ln
- 4591 Tumbleweed Dr
- 4533 Haystack Ln
- 4600 Haystack Ln
- 4573 Haystack Ln
- 4560 Tumbleweed Dr
- 4590 Tumbleweed Dr
- 4530 Tumbleweed Dr
- 0 Tumbleweed Dr
- 4613 Tumbleweed Dr
- 4628 Haystack Ln
- 685 Millet Cir
- 687 Millet Cir
- 683 Millet Cir
- 693 Millet Cir
Your Personal Tour Guide
Ask me questions while you tour the home.