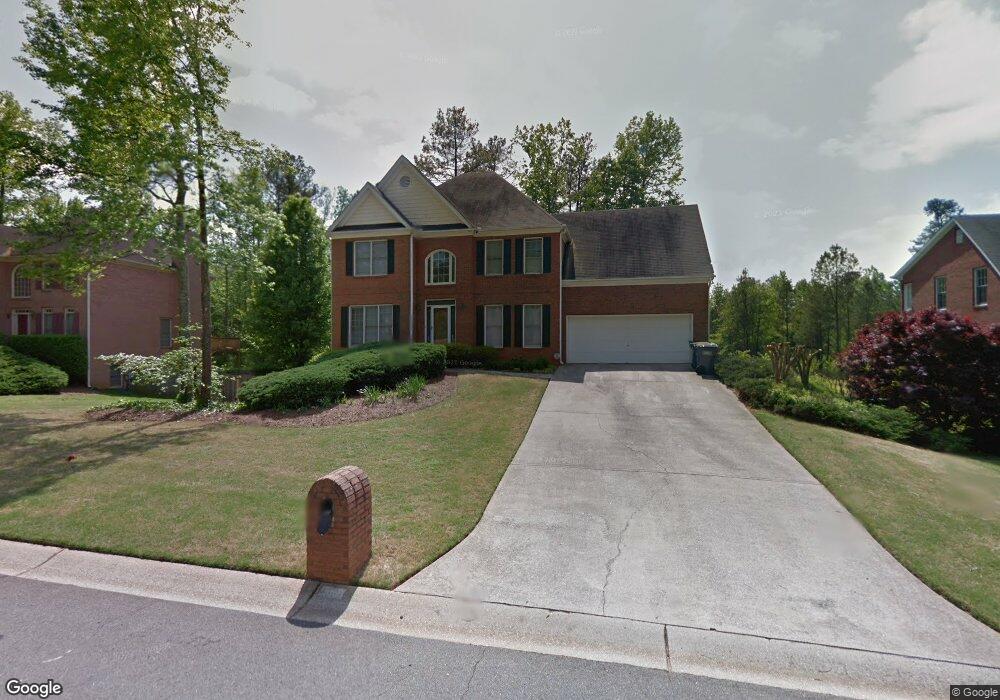
4562 Glore Crossing Dr SW Mableton, GA 30126
Estimated Value: $454,782 - $538,000
4
Beds
4
Baths
2,948
Sq Ft
$173/Sq Ft
Est. Value
About This Home
This home is located at 4562 Glore Crossing Dr SW, Mableton, GA 30126 and is currently estimated at $508,696, approximately $172 per square foot. 4562 Glore Crossing Dr SW is a home located in Cobb County with nearby schools including Deerwood Elementary School, Mableton Elementary School, and Floyd Middle School.
Ownership History
Date
Name
Owned For
Owner Type
Purchase Details
Closed on
Jul 24, 2001
Sold by
Moore Juan and Moore Cynthia
Bought by
Moore Juan D and Moore Cynthia T
Current Estimated Value
Home Financials for this Owner
Home Financials are based on the most recent Mortgage that was taken out on this home.
Original Mortgage
$241,530
Outstanding Balance
$92,741
Interest Rate
7.09%
Mortgage Type
New Conventional
Estimated Equity
$415,955
Purchase Details
Closed on
Apr 21, 1995
Sold by
Live Oak Builders Inc
Bought by
Moore Juan Cynthia
Create a Home Valuation Report for This Property
The Home Valuation Report is an in-depth analysis detailing your home's value as well as a comparison with similar homes in the area
Home Values in the Area
Average Home Value in this Area
Purchase History
| Date | Buyer | Sale Price | Title Company |
|---|---|---|---|
| Moore Juan D | -- | -- | |
| Moore Juan Cynthia | $189,000 | -- |
Source: Public Records
Mortgage History
| Date | Status | Borrower | Loan Amount |
|---|---|---|---|
| Open | Moore Juan D | $241,530 | |
| Closed | Moore Juan Cynthia | $0 |
Source: Public Records
Tax History Compared to Growth
Tax History
| Year | Tax Paid | Tax Assessment Tax Assessment Total Assessment is a certain percentage of the fair market value that is determined by local assessors to be the total taxable value of land and additions on the property. | Land | Improvement |
|---|---|---|---|---|
| 2025 | $5,510 | $227,452 | $32,000 | $195,452 |
| 2024 | $5,515 | $227,452 | $32,000 | $195,452 |
| 2023 | $3,591 | $163,760 | $20,000 | $143,760 |
| 2022 | $4,164 | $163,760 | $20,000 | $143,760 |
| 2021 | $3,533 | $134,936 | $20,000 | $114,936 |
| 2020 | $3,341 | $126,164 | $20,000 | $106,164 |
| 2019 | $3,341 | $126,164 | $20,000 | $106,164 |
| 2018 | $3,341 | $126,164 | $20,000 | $106,164 |
| 2017 | $3,199 | $126,164 | $20,000 | $106,164 |
| 2016 | $3,036 | $118,616 | $20,000 | $98,616 |
| 2015 | $2,923 | $110,376 | $23,400 | $86,976 |
| 2014 | $2,947 | $110,376 | $0 | $0 |
Source: Public Records
Map
Nearby Homes
- Linden Plan at Sweetlake Grove - Bungalow Series
- 4690 Glore Rd SW
- 4612 Springside Ct SW
- 8009 Haven Springs Trace
- 8029 Haven Springs Trace
- 8025 Haven Springs Trace
- 8041 Haven Springs Trace
- 1078 Hibiscus Way SW
- 4556 Sweetlake Rd SW
- 960 Verlander Trail
- 971 Verlander Trail
- 1240 Parktown Dr Unit 4
- 1021 Wisteria Dr SW
- 4630 Brookwood Dr SW
- Kaufman Plan at Wilkins Walk
- Bryson Plan at Wilkins Walk
- Brooks Plan at Wilkins Walk
- 4569 Moray Dr
- 4581 Moray Dr
- 4589 Moray Dr
- 4560 Glore Crossing Dr SW
- 4564 Glore Crossing Dr SW
- 4558 Glore Crossing Dr SW
- 4566 Glore Crossing Dr SW
- 1154 Abram Ct SW
- 0 Abram Ct
- 4557 Glore Crossing Dr SW
- 4568 Glore Crossing Dr SW
- 4561 Glore Crossing Dr SW
- 4556 Glore Crossing Dr SW
- 0 Glore Crossing Dr Unit 8862620
- 0 Glore Crossing Dr
- 1152 Abram Ct SW
- 4678 Glore Rd SW Unit 37234569
- 4678 Glore Rd SW Unit 37234556
- 4678 Glore Rd SW Unit 37234493
- 4678 Glore Rd SW Unit 37234191
- 4678 Glore Rd SW Unit 37168493
- 4678 Glore Rd SW Unit 37168182
- 4678 Glore Rd SW Unit 37167493