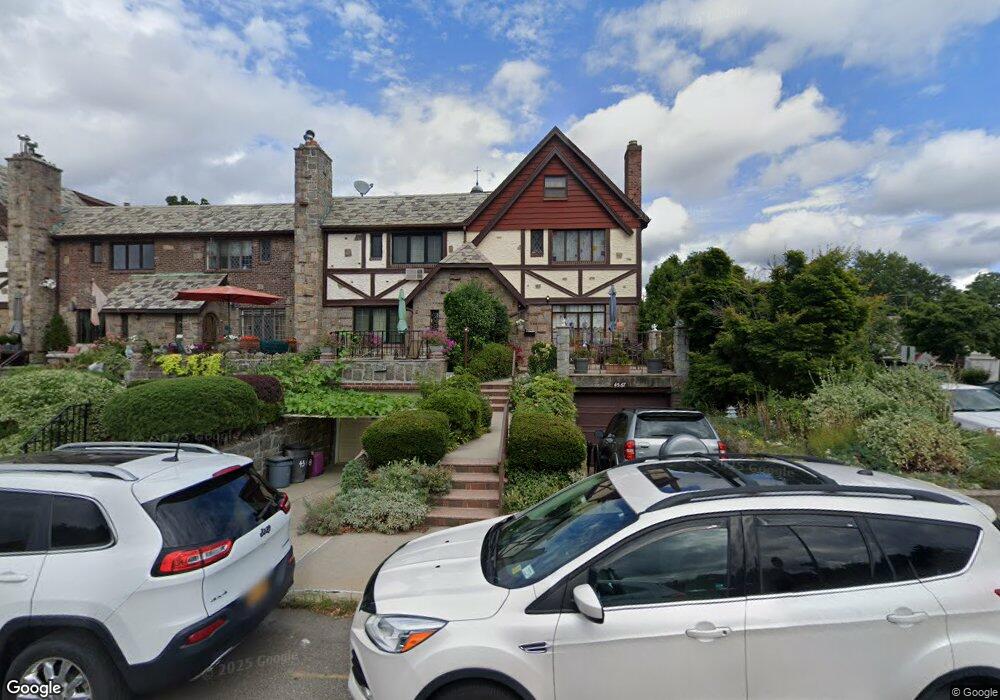
4565 194th St Flushing, NY 11358
Auburndale NeighborhoodEstimated Value: $1,045,000 - $1,108,000
Studio
3
Baths
1,680
Sq Ft
$645/Sq Ft
Est. Value
About This Home
This home is located at 4565 194th St, Flushing, NY 11358 and is currently estimated at $1,083,163, approximately $644 per square foot. 4565 194th St is a home located in Queens County with nearby schools including P.S. 107 Thomas A Dooley, I.S. 25 Adrien Block, and Francis Lewis High School.
Ownership History
Date
Name
Owned For
Owner Type
Purchase Details
Closed on
Mar 23, 2011
Sold by
Rapuano Estate Of Linda S
Bought by
Rapuano Michele L and Stracuzzi Carmelo F
Current Estimated Value
Home Financials for this Owner
Home Financials are based on the most recent Mortgage that was taken out on this home.
Original Mortgage
$300,000
Outstanding Balance
$207,195
Interest Rate
4.9%
Mortgage Type
Purchase Money Mortgage
Estimated Equity
$875,968
Create a Home Valuation Report for This Property
The Home Valuation Report is an in-depth analysis detailing your home's value as well as a comparison with similar homes in the area
Home Values in the Area
Average Home Value in this Area
Purchase History
| Date | Buyer | Sale Price | Title Company |
|---|---|---|---|
| Rapuano Michele L | $500,000 | -- |
Source: Public Records
Mortgage History
| Date | Status | Borrower | Loan Amount |
|---|---|---|---|
| Open | Rapuano Michele L | $300,000 |
Source: Public Records
Tax History
| Year | Tax Paid | Tax Assessment Tax Assessment Total Assessment is a certain percentage of the fair market value that is determined by local assessors to be the total taxable value of land and additions on the property. | Land | Improvement |
|---|---|---|---|---|
| 2025 | $8,700 | $45,899 | $12,980 | $32,919 |
| 2024 | $8,712 | $44,716 | $12,964 | $31,752 |
| 2023 | $8,268 | $42,564 | $10,612 | $31,952 |
| 2022 | $7,378 | $56,220 | $16,560 | $39,660 |
| 2021 | $7,756 | $58,920 | $16,560 | $42,360 |
| 2020 | $7,800 | $57,300 | $16,560 | $40,740 |
| 2019 | $7,502 | $57,660 | $16,560 | $41,100 |
| 2018 | $6,933 | $35,470 | $11,436 | $24,034 |
| 2017 | $6,566 | $33,679 | $11,871 | $21,808 |
| 2016 | $6,064 | $33,679 | $11,871 | $21,808 |
| 2015 | $3,612 | $31,874 | $13,880 | $17,994 |
| 2014 | $3,612 | $31,053 | $14,532 | $16,521 |
Source: Public Records
Map
Nearby Homes
- 4604 195th St
- 45-47 193rd St
- 4552 196th St
- 45-31 195th St
- 4539 192nd St
- 45-66 196th Place
- 47-55 194th St
- 47-49 194th St
- 4719 192nd St
- 4756 196th St
- 43-44 195th St
- 43-28 196th St
- 47-18 190th St
- 196-64 45th Ave
- 19005 48th Ave
- 199-04 47th Ave
- 47-02 Francis Lewis Blvd
- 45-32 Utopia Pkwy
- 4818 190th St
- 200-38 45th Ave
Your Personal Tour Guide
Ask me questions while you tour the home.