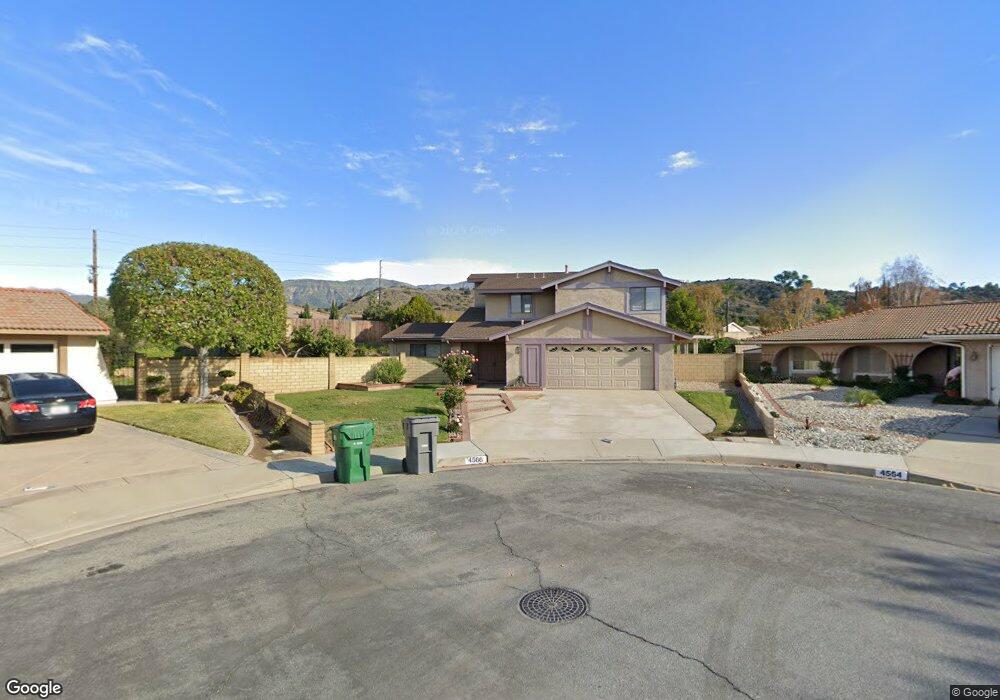
4566 Peck Cir La Verne, CA 91750
South La Verne NeighborhoodEstimated Value: $965,000 - $1,051,000
3
Beds
3
Baths
1,985
Sq Ft
$513/Sq Ft
Est. Value
About This Home
This home is located at 4566 Peck Cir, La Verne, CA 91750 and is currently estimated at $1,018,833, approximately $513 per square foot. 4566 Peck Cir is a home located in Los Angeles County with nearby schools including La Verne Heights Elementary School, Ramona Middle School, and Bonita High School.
Ownership History
Date
Name
Owned For
Owner Type
Purchase Details
Closed on
Sep 11, 2018
Sold by
Patel Natvarbhai P and Patel Dharmisthben N
Bought by
Patel Natvarbhai P and Patel Dharmisthaben N
Current Estimated Value
Purchase Details
Closed on
Dec 2, 1993
Sold by
Patel Natvarbhai P and Patel Dharmistaben N
Bought by
Patel Natvarbhai P and Patel Dharmistaben N
Home Financials for this Owner
Home Financials are based on the most recent Mortgage that was taken out on this home.
Original Mortgage
$135,000
Interest Rate
6.89%
Create a Home Valuation Report for This Property
The Home Valuation Report is an in-depth analysis detailing your home's value as well as a comparison with similar homes in the area
Home Values in the Area
Average Home Value in this Area
Purchase History
| Date | Buyer | Sale Price | Title Company |
|---|---|---|---|
| Patel Natvarbhai P | -- | None Available | |
| Patel Natvarbhai P | -- | Chicago Title Insurance Co |
Source: Public Records
Mortgage History
| Date | Status | Borrower | Loan Amount |
|---|---|---|---|
| Closed | Patel Natvarbhai P | $135,000 |
Source: Public Records
Tax History Compared to Growth
Tax History
| Year | Tax Paid | Tax Assessment Tax Assessment Total Assessment is a certain percentage of the fair market value that is determined by local assessors to be the total taxable value of land and additions on the property. | Land | Improvement |
|---|---|---|---|---|
| 2025 | $4,540 | $372,436 | $107,324 | $265,112 |
| 2024 | $4,540 | $365,134 | $105,220 | $259,914 |
| 2023 | $4,443 | $357,975 | $103,157 | $254,818 |
| 2022 | $4,371 | $350,957 | $101,135 | $249,822 |
| 2021 | $4,282 | $344,076 | $99,152 | $244,924 |
| 2019 | $4,198 | $333,872 | $96,212 | $237,660 |
| 2018 | $3,950 | $327,326 | $94,326 | $233,000 |
| 2017 | $3,880 | $320,909 | $92,477 | $228,432 |
| 2016 | $3,791 | $314,617 | $90,664 | $223,953 |
| 2015 | $3,728 | $309,893 | $89,303 | $220,590 |
| 2014 | $3,695 | $303,823 | $87,554 | $216,269 |
Source: Public Records
Map
Nearby Homes
- 4700 Emerald Ave
- 4095 Fruit St Unit Spc 328
- 4095 Fruit St Unit 613
- 4095 Fruit St Unit 606
- 4095 Fruit St Unit 108
- 4095 Fruit St Unit 603
- 4095 Fruit St Unit 743
- 4095 Fruit St Unit 607
- 1937 Citruswood St
- 15 Yucca Ct Unit 15
- 2516 Baseline Rd
- 3888 Chelsea Dr
- 1753 Eaton Place
- 521 Baseline Rd
- 1638 Larch Place
- 3788 Verdana Cir
- 3810 Abbey Way
- 0 Broken Spur Rd
- 1907 Canopy Ln
- 350 Roughrider Rd
- 4554 Peck Cir
- 2148 Baseline Rd
- 2134 Baseline Rd
- 4567 Peck Cir
- 2160 Baseline Rd
- 4546 Peck Cir
- 2183 Pinto St
- 2126 Baseline Rd
- 4555 Peck Cir
- 2177 Pinto St
- 2172 Baseline Rd
- 4543 Peck Cir
- 2189 Pinto St
- 4532 Peck Cir
- 2114 Baseline Rd
- 2171 Pinto St
- 4531 Peck Cir
- 4568 Miller St
- 4556 Miller St
- 2184 Baseline Rd