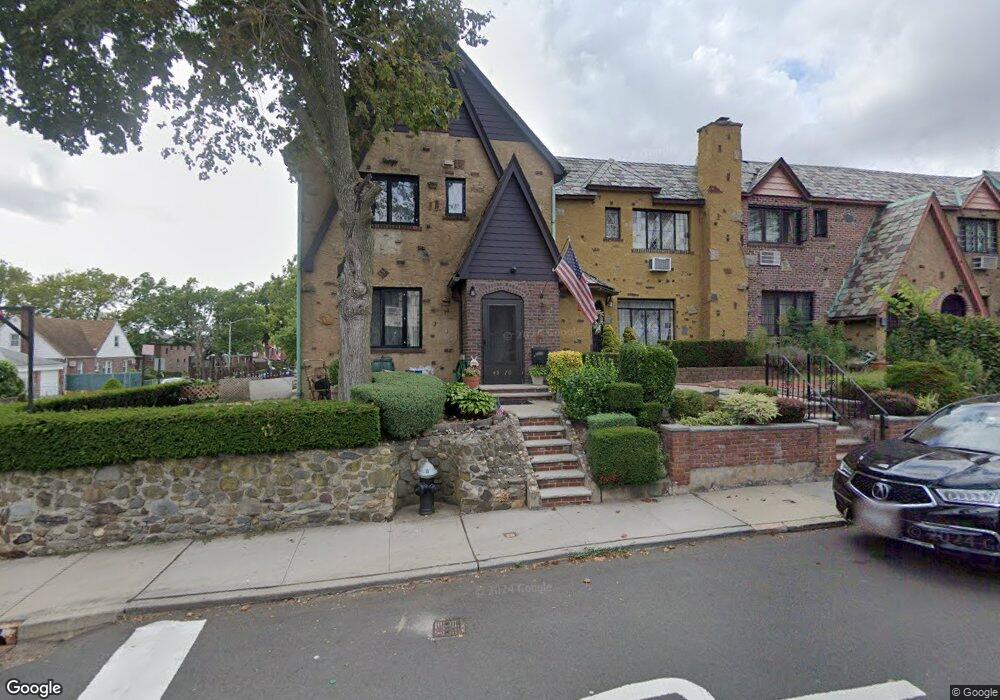
4568 193rd St Flushing, NY 11358
Auburndale NeighborhoodEstimated Value: $982,000 - $1,065,000
--
Bed
--
Bath
1,600
Sq Ft
$630/Sq Ft
Est. Value
About This Home
This home is located at 4568 193rd St, Flushing, NY 11358 and is currently estimated at $1,008,360, approximately $630 per square foot. 4568 193rd St is a home located in Queens County with nearby schools including P.S. 107 Thomas A Dooley, I.S. 25 Adrien Block, and Francis Lewis High School.
Ownership History
Date
Name
Owned For
Owner Type
Purchase Details
Closed on
Oct 27, 2022
Sold by
Tsioutas Erica A and Tsioutas Haralambos
Bought by
Mo Jan Chao and Yeung Michelle Suetying
Current Estimated Value
Home Financials for this Owner
Home Financials are based on the most recent Mortgage that was taken out on this home.
Original Mortgage
$650,000
Outstanding Balance
$627,535
Interest Rate
6.7%
Mortgage Type
Purchase Money Mortgage
Estimated Equity
$380,825
Purchase Details
Closed on
Jun 15, 2010
Sold by
Infante Doreen
Bought by
Tsioutas Erica A and Tsioutas Haralambos
Home Financials for this Owner
Home Financials are based on the most recent Mortgage that was taken out on this home.
Original Mortgage
$562,500
Interest Rate
5.03%
Mortgage Type
Purchase Money Mortgage
Purchase Details
Closed on
Nov 28, 2009
Sold by
Infante Doreen
Bought by
Doreen Infante Living Trust Dated /2 and Doreen Infante Trustee
Purchase Details
Closed on
Jul 16, 1998
Sold by
Infante Ralph
Bought by
Infante Doreen
Create a Home Valuation Report for This Property
The Home Valuation Report is an in-depth analysis detailing your home's value as well as a comparison with similar homes in the area
Home Values in the Area
Average Home Value in this Area
Purchase History
| Date | Buyer | Sale Price | Title Company |
|---|---|---|---|
| Mo Jan Chao | $968,000 | -- | |
| Mo Jan Chao | $968,000 | -- | |
| Mo Jan Chao | $968,000 | -- | |
| Tsioutas Erica A | $625,000 | -- | |
| Tsioutas Erica A | $625,000 | -- | |
| Doreen Infante Living Trust Dated /2 | -- | -- | |
| Doreen Infante Living Trust Dated /2 | -- | -- | |
| Infante Doreen | -- | -- | |
| Infante Doreen | -- | -- |
Source: Public Records
Mortgage History
| Date | Status | Borrower | Loan Amount |
|---|---|---|---|
| Open | Mo Jan Chao | $650,000 | |
| Closed | Mo Jan Chao | $650,000 | |
| Previous Owner | Tsioutas Erica A | $562,500 |
Source: Public Records
Tax History Compared to Growth
Tax History
| Year | Tax Paid | Tax Assessment Tax Assessment Total Assessment is a certain percentage of the fair market value that is determined by local assessors to be the total taxable value of land and additions on the property. | Land | Improvement |
|---|---|---|---|---|
| 2025 | $9,156 | $48,318 | $15,725 | $32,593 |
| 2024 | $9,156 | $45,584 | $13,928 | $31,656 |
| 2023 | $8,857 | $44,098 | $13,153 | $30,945 |
| 2022 | $8,305 | $52,680 | $16,500 | $36,180 |
| 2021 | $8,755 | $55,560 | $16,500 | $39,060 |
| 2020 | $8,523 | $53,520 | $16,500 | $37,020 |
| 2019 | $7,947 | $53,820 | $16,500 | $37,320 |
| 2018 | $7,193 | $36,748 | $11,806 | $24,942 |
| 2017 | $6,768 | $34,669 | $12,780 | $21,889 |
| 2016 | $6,621 | $34,669 | $12,780 | $21,889 |
| 2015 | $3,725 | $33,554 | $15,006 | $18,548 |
| 2014 | $3,725 | $31,656 | $16,012 | $15,644 |
Source: Public Records
Map
Nearby Homes
- 4570 193rd St
- 45-68 193rd St
- 4566 193rd St
- 4566 193rd St
- 4564 193rd St
- 46-02 193rd St
- 4562 193rd St
- 4602 193rd St
- 4567 192nd St
- 4602 193rd St
- 4560 193rd St
- 45-60 193rd St
- 4563 192nd St
- 46-04 193rd St
- 4604 193rd St
- 4558 193rd St
- 4563 192nd St Unit 2nd Fl
- 4563 192nd St Unit 2nd Fl
- 4558 193rd St
- 4559 192nd St