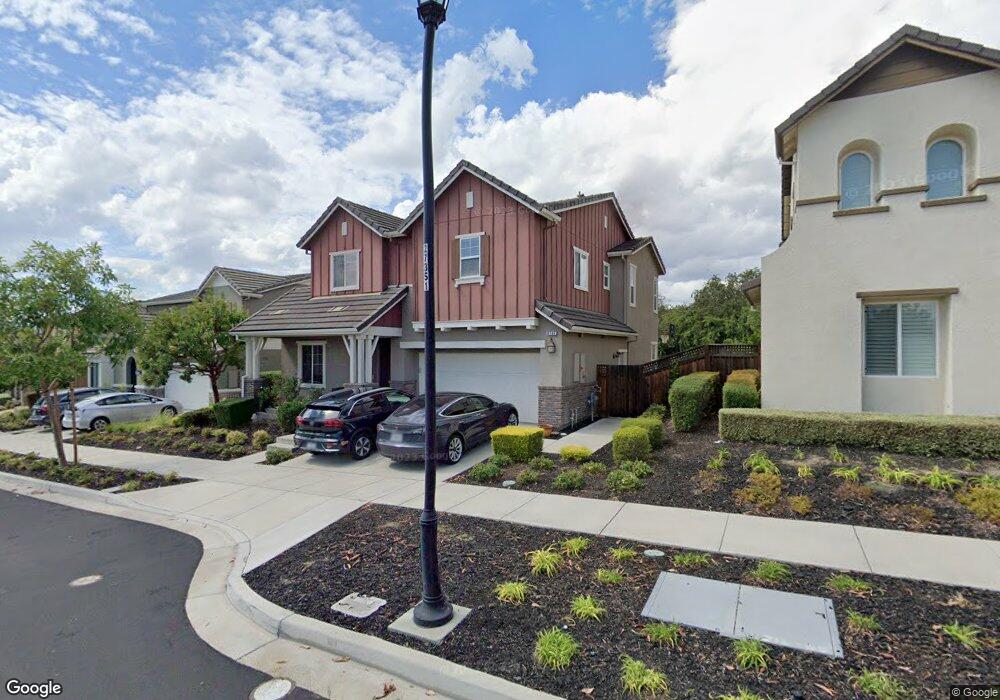
4568 Alta Terra Rd Dublin, CA 94568
Estimated Value: $1,695,000 - $1,911,000
5
Beds
3
Baths
2,457
Sq Ft
$741/Sq Ft
Est. Value
About This Home
This home is located at 4568 Alta Terra Rd, Dublin, CA 94568 and is currently estimated at $1,821,857, approximately $741 per square foot. 4568 Alta Terra Rd is a home with nearby schools including J.M. Amador Elementary School, Dublin High School, and SPRINGFIELD MONTESSORI SCHOOL.
Ownership History
Date
Name
Owned For
Owner Type
Purchase Details
Closed on
Jan 5, 2021
Sold by
Mangamuri Seetha Ramaiah and Punti Madhavi Latha
Bought by
Mangamuri Seetha Ramaiah and Punati Madhavi Latha
Current Estimated Value
Home Financials for this Owner
Home Financials are based on the most recent Mortgage that was taken out on this home.
Original Mortgage
$577,000
Outstanding Balance
$421,795
Interest Rate
2.7%
Mortgage Type
New Conventional
Estimated Equity
$1,400,062
Purchase Details
Closed on
Mar 15, 2014
Sold by
Mangamuri Seetha Ramaiah and Punati Madhavi Latha
Bought by
Mangamuri Punati Family Trust
Purchase Details
Closed on
Sep 26, 2012
Sold by
Brookfield Windwood Llc
Bought by
Mangamuri Seetha R and Punati Madhavi Latha
Home Financials for this Owner
Home Financials are based on the most recent Mortgage that was taken out on this home.
Original Mortgage
$685,239
Interest Rate
3.75%
Mortgage Type
FHA
Create a Home Valuation Report for This Property
The Home Valuation Report is an in-depth analysis detailing your home's value as well as a comparison with similar homes in the area
Purchase History
| Date | Buyer | Sale Price | Title Company |
|---|---|---|---|
| Mangamuri Seetha Ramaiah | -- | Chicago Title Company | |
| Mangamuri Seetha Ramaiah | -- | Chicago Title Company | |
| Mangamuri Punati Family Trust | -- | None Available | |
| Mangamuri Seetha R | $698,000 | First American Title Company |
Source: Public Records
Mortgage History
| Date | Status | Borrower | Loan Amount |
|---|---|---|---|
| Open | Mangamuri Seetha Ramaiah | $577,000 | |
| Closed | Mangamuri Seetha R | $685,239 |
Source: Public Records
Tax History
| Year | Tax Paid | Tax Assessment Tax Assessment Total Assessment is a certain percentage of the fair market value that is determined by local assessors to be the total taxable value of land and additions on the property. | Land | Improvement |
|---|---|---|---|---|
| 2025 | $11,919 | $852,256 | $257,777 | $601,479 |
| 2024 | $11,919 | $835,411 | $252,723 | $589,688 |
| 2023 | $12,132 | $825,894 | $247,768 | $578,126 |
| 2022 | $11,961 | $802,705 | $242,911 | $566,794 |
| 2021 | $11,831 | $786,830 | $238,149 | $555,681 |
| 2020 | $11,102 | $785,694 | $235,708 | $549,986 |
| 2019 | $11,066 | $770,294 | $231,088 | $539,206 |
| 2018 | $12,666 | $755,193 | $226,558 | $528,635 |
| 2017 | $12,510 | $740,386 | $222,116 | $518,270 |
| 2016 | $11,608 | $725,871 | $217,761 | $508,110 |
| 2015 | $9,389 | $714,972 | $214,491 | $500,481 |
| 2014 | $9,383 | $700,967 | $210,290 | $490,677 |
Source: Public Records
Map
Nearby Homes
- 3956 Jordan Ranch Dr
- 2336 Carbondale Way
- 2239 Central Pkwy
- 4371 Panorama Dr
- 4433 Cherico Ln
- 5271 Salerno Dr
- 3198 Vittoria Loop
- 2008 Confidence Way
- 2100 Carbondale Cir
- 1937 Whitney Ave
- 1949 Michael Ave
- 1935 Ingalls Way
- 1705 Central Pkwy
- 4052 Knightstown St
- 1913 Michael Ave
- 4038 Knightstown St
- 1901 Michael Ave
- 2933 Stringham Way
- 3225 Central Pkwy
- 1691 S Wren St
- 4564 Alta Terra Rd
- 4572 Alta Terra Rd
- 4560 Alta Terra Rd
- 4578 Alta Terra Rd
- 2636 Avery Way
- 4577 Alta Terra Rd
- 2655 Whitehorse Way
- 2630 Avery Way
- 4582 Alta Terra Rd
- 4556 Alta Terra Rd
- 2637 Whitehorse Way
- 4581 Alta Terra Rd
- 2622 Avery Way
- 4588 Alta Terra Rd
- 4552 Alta Terra Rd
- 4743 Piper Glen Terrace
- 2625 Whitehorse Way
- 2610 Avery Way
- 4757 Piper Glen Terrace
- 4592 Alta Terra Rd
Your Personal Tour Guide
Ask me questions while you tour the home.