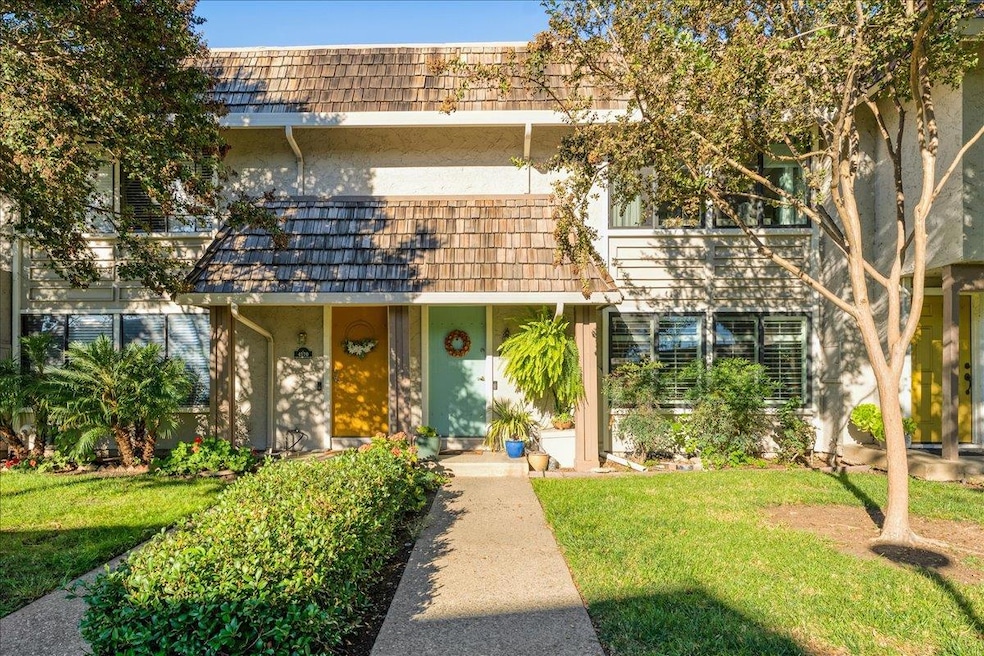
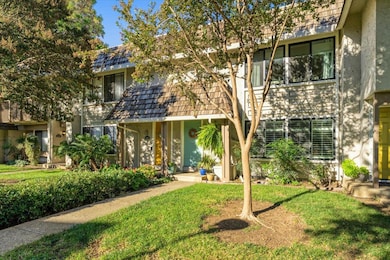
4568 Cimarron River Ct San Jose, CA 95136
Blossom Valley NeighborhoodEstimated payment $5,854/month
Highlights
- Private Pool
- Quartz Countertops
- Neighborhood Views
- Clubhouse
- Wine Refrigerator
- Formal Dining Room
About This Home
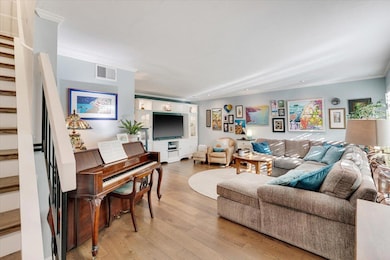
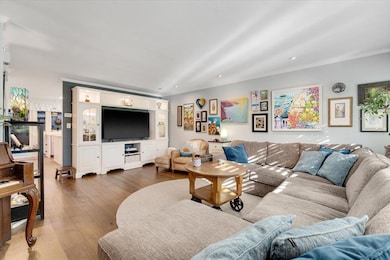
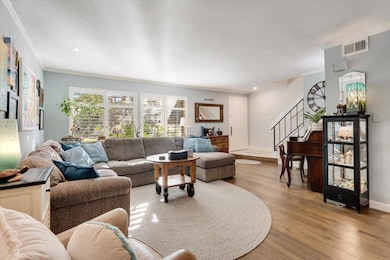
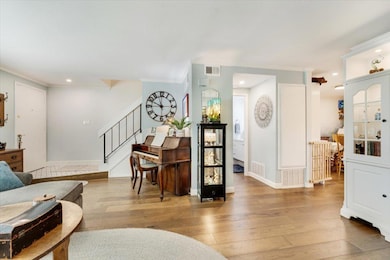
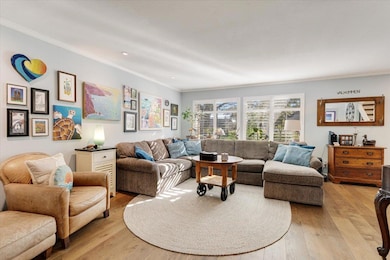
One of the nicest remodeled townhomes I've seen in a long time is right here at Cimarron River Ct! The owners have remodeled just about everything within the last 5 years and it gives such a warm vibe of quality and comfort! This spacious residence features 3 bedrooms and 2 full bathrooms, complemented by a half bath on the ground floor. The heart of the home is the impressive kitchen, with beautiful laminate flooring throughout, equipped with quartz countertops, large farmhouse sink, an island, and high-end SS appliances. Additional amenities include central AC, window out to the most beautiful zen green courtyard, Ring doorbell, plantation shutters, whole house water filtering system and energy-efficient features such as double pane windows and attached 2 car garage with extra storage. Convenient upstairs laundry facilities with a washer and dryer ensure ease in everyday living. Located within the San Jose Unified School District, this home is ideal for families. Community features include access to a lap pool & kiddie pool. Hang Out In The Game Room or Chill Out At The BBQ & Picnic Areas. Community Clubhouse w/ Huge Kitchen & Event Space Great Location Near Schools, Parks, Shopping, Dining, VTA Light Rail, Freeway Access. You don't want to miss this one!
Townhouse Details
Home Type
- Townhome
Est. Annual Taxes
- $4,879
Year Built
- Built in 1973
Lot Details
- Fenced
- Grass Covered Lot
HOA Fees
- $580 Monthly HOA Fees
Parking
- 2 Car Detached Garage
- On-Street Parking
Home Design
- Slab Foundation
- Composition Roof
Interior Spaces
- 1,496 Sq Ft Home
- 2-Story Property
- Double Pane Windows
- Garden Windows
- Formal Dining Room
- Laminate Flooring
- Neighborhood Views
Kitchen
- Eat-In Kitchen
- Electric Oven
- Microwave
- Ice Maker
- Wine Refrigerator
- Kitchen Island
- Quartz Countertops
- Disposal
Bedrooms and Bathrooms
- 3 Bedrooms
- Remodeled Bathroom
- Bathroom on Main Level
- Low Flow Toliet
- Bathtub with Shower
Laundry
- Laundry on upper level
- Washer and Dryer
Additional Features
- Energy-Efficient Insulation
- Private Pool
- Forced Air Heating and Cooling System
Listing and Financial Details
- Assessor Parcel Number 458-23-048
Community Details
Overview
- Association fees include exterior painting, landscaping / gardening, maintenance - common area, pool spa or tennis, roof, water
- Branham HOA
- Built by Tanglewood Complex
Amenities
- Clubhouse
Recreation
- Lap or Exercise Community Pool
Map
Home Values in the Area
Average Home Value in this Area
Tax History
| Year | Tax Paid | Tax Assessment Tax Assessment Total Assessment is a certain percentage of the fair market value that is determined by local assessors to be the total taxable value of land and additions on the property. | Land | Improvement |
|---|---|---|---|---|
| 2025 | $4,879 | $303,598 | $127,934 | $175,664 |
| 2024 | $4,879 | $297,646 | $125,426 | $172,220 |
| 2023 | $4,753 | $291,811 | $122,967 | $168,844 |
| 2022 | $4,712 | $286,090 | $120,556 | $165,534 |
| 2021 | $4,571 | $280,482 | $118,193 | $162,289 |
| 2020 | $4,431 | $277,607 | $116,982 | $160,625 |
| 2019 | $4,315 | $272,165 | $114,689 | $157,476 |
| 2018 | $4,254 | $266,830 | $112,441 | $154,389 |
| 2017 | $4,207 | $261,599 | $110,237 | $151,362 |
| 2016 | $4,060 | $256,471 | $108,076 | $148,395 |
| 2015 | $4,661 | $252,619 | $106,453 | $146,166 |
| 2014 | $3,596 | $247,671 | $104,368 | $143,303 |
Property History
| Date | Event | Price | List to Sale | Price per Sq Ft |
|---|---|---|---|---|
| 11/15/2025 11/15/25 | Price Changed | $928,000 | -2.2% | $620 / Sq Ft |
| 11/07/2025 11/07/25 | Price Changed | $949,000 | +1.1% | $634 / Sq Ft |
| 10/20/2025 10/20/25 | For Sale | $939,000 | -- | $628 / Sq Ft |
Purchase History
| Date | Type | Sale Price | Title Company |
|---|---|---|---|
| Grant Deed | $140,000 | North American Title Company | |
| Interfamily Deed Transfer | -- | None Available | |
| Interfamily Deed Transfer | -- | None Available | |
| Quit Claim Deed | -- | -- | |
| Quit Claim Deed | -- | -- | |
| Grant Deed | -- | Santa Clara Land Title Co | |
| Grant Deed | -- | Santa Cruz Title Company |
Mortgage History
| Date | Status | Loan Amount | Loan Type |
|---|---|---|---|
| Open | $140,000 | New Conventional | |
| Previous Owner | $55,000 | No Value Available |
Source: MLSListings
MLS Number: ML82025373
APN: 458-23-048
Disclaimer: Certain information contained herein is derived from information provided by parties other than Homes.com. All information provided is deemed reliable, but is not guaranteed to be accurate and should be independently verified.
![]() Property Information © 2025 MLSListings Inc. All rights reserved. Listing information is deemed reliable but not guaranteed. Certain information contained herein is derived from information which is the licensed property of, and copyrighted by, MLSListings Inc. The viewer acknowledges ownership and validity of its copyright. Information provided is for personal, non-commercial use by a viewer with a bona fide interest in the purchase or sale of real estate of the type being offered via this website or other electronic means. The viewer is prohibited from copying, redistributing or retransmitting any of the data or information provided by MLSListing, Inc.
Property Information © 2025 MLSListings Inc. All rights reserved. Listing information is deemed reliable but not guaranteed. Certain information contained herein is derived from information which is the licensed property of, and copyrighted by, MLSListings Inc. The viewer acknowledges ownership and validity of its copyright. Information provided is for personal, non-commercial use by a viewer with a bona fide interest in the purchase or sale of real estate of the type being offered via this website or other electronic means. The viewer is prohibited from copying, redistributing or retransmitting any of the data or information provided by MLSListing, Inc.
- 4586 Cimarron River Ct
- 4581 Shadowhurst Ct
- 883 Calle de Verde
- 668 Potomac Ct
- 4537 Windsor Park Dr
- 704 Cassaday Ct Unit 708
- 481 Barron Park Ct
- 4790 Canela Way
- 398 Bluefield Dr
- 326 Springpark Cir
- 3349 Midtown Place Unit 67
- 344 Viewpark Cir
- 3300 Narvaez Ave Unit 175
- 5510 Dunsburry Way
- 337 Ballymore Cir
- 4397 Dulcey Dr
- 4501 Waterville Dr
- 4519 Waterville Dr
- 4570 Waterville Dr
- 1063 Foxchase Dr Unit 75
- 4407 Jonquil Dr
- 5230 Terner Way
- 3908 Jerabek Ct
- 3601 Copperfield Dr
- 1022 Cedar Gables Dr Unit NA
- 1088 Cedar Gables Dr
- 4203 Briarglen Dr
- 1070 Foxchase Dr
- 3188 Heather Ridge Dr Unit Spare Room
- 401 Briar Ridge Dr
- 3200 Rubino Dr Unit FL3-ID10546A
- 3200 Rubino Dr Unit FL2-ID4842A
- 3200 Rubino Dr Unit FL3-ID3729A
- 3200 Rubino Dr Unit FL3-ID9100A
- 3110 Rubino Dr Unit FL3-ID886
- 3130 Rubino Dr Unit FL2-ID1091
- 5730 Allen Ave
- 3200 Rubino Dr
- 4951 Cherry Ave
- 3030 Canoas Creek Ct
