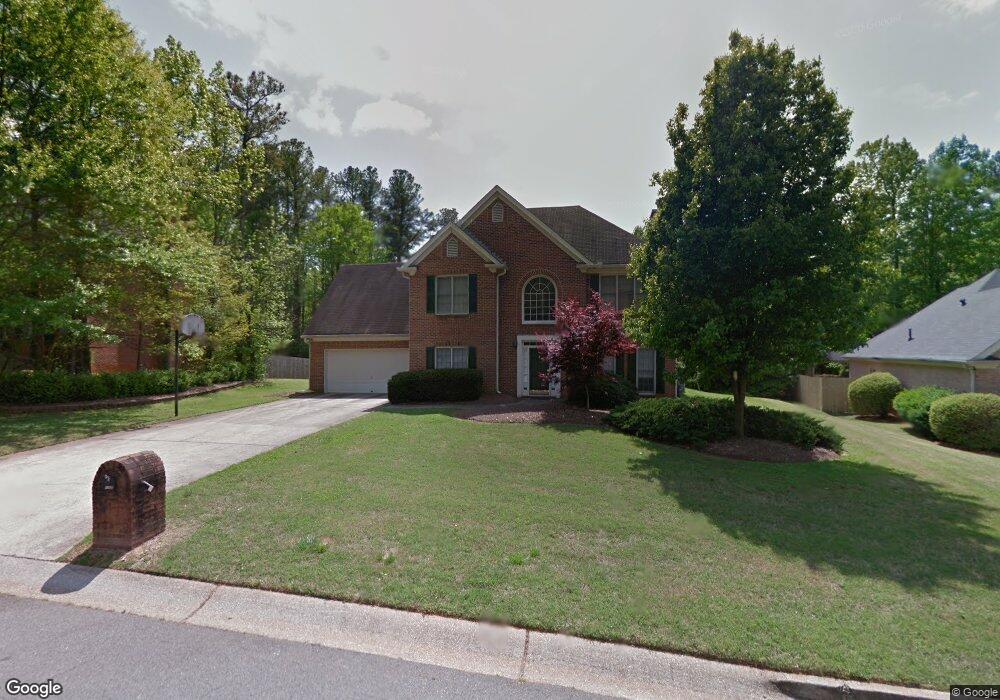
4568 Glore Crossing Dr SW Mableton, GA 30126
Estimated Value: $412,029 - $495,000
4
Beds
3
Baths
2,422
Sq Ft
$187/Sq Ft
Est. Value
About This Home
This home is located at 4568 Glore Crossing Dr SW, Mableton, GA 30126 and is currently estimated at $451,757, approximately $186 per square foot. 4568 Glore Crossing Dr SW is a home located in Cobb County with nearby schools including Deerwood Elementary School, Mableton Elementary School, and Floyd Middle School.
Ownership History
Date
Name
Owned For
Owner Type
Purchase Details
Closed on
Jan 17, 2002
Sold by
Sledge Dennis J
Bought by
Sledge Dennis J and Sledge Patricia
Current Estimated Value
Home Financials for this Owner
Home Financials are based on the most recent Mortgage that was taken out on this home.
Original Mortgage
$179,254
Interest Rate
7.12%
Mortgage Type
FHA
Purchase Details
Closed on
Apr 5, 1996
Sold by
Heisey K Charles Katherin
Bought by
Sledge Dennis J
Purchase Details
Closed on
Jul 16, 1993
Sold by
Live Oak Bldrs
Bought by
Heisey K Charles
Home Financials for this Owner
Home Financials are based on the most recent Mortgage that was taken out on this home.
Original Mortgage
$138,400
Interest Rate
7.49%
Create a Home Valuation Report for This Property
The Home Valuation Report is an in-depth analysis detailing your home's value as well as a comparison with similar homes in the area
Home Values in the Area
Average Home Value in this Area
Purchase History
| Date | Buyer | Sale Price | Title Company |
|---|---|---|---|
| Sledge Dennis J | -- | -- | |
| Sledge Dennis J | $154,500 | -- | |
| Heisey K Charles | $145,700 | -- |
Source: Public Records
Mortgage History
| Date | Status | Borrower | Loan Amount |
|---|---|---|---|
| Closed | Sledge Dennis J | $179,254 | |
| Previous Owner | Heisey K Charles | $138,400 |
Source: Public Records
Tax History Compared to Growth
Tax History
| Year | Tax Paid | Tax Assessment Tax Assessment Total Assessment is a certain percentage of the fair market value that is determined by local assessors to be the total taxable value of land and additions on the property. | Land | Improvement |
|---|---|---|---|---|
| 2025 | $4,461 | $179,572 | $32,000 | $147,572 |
| 2024 | $4,464 | $179,572 | $32,000 | $147,572 |
| 2023 | $3,131 | $143,116 | $20,000 | $123,116 |
| 2022 | $3,700 | $143,116 | $20,000 | $123,116 |
| 2021 | $3,065 | $114,100 | $20,000 | $94,100 |
| 2020 | $3,017 | $99,392 | $20,000 | $79,392 |
| 2019 | $3,017 | $99,392 | $20,000 | $79,392 |
| 2018 | $3,017 | $99,392 | $20,000 | $79,392 |
| 2017 | $2,858 | $99,392 | $20,000 | $79,392 |
| 2016 | $2,328 | $80,980 | $20,000 | $60,980 |
| 2015 | $2,379 | $80,740 | $23,400 | $57,340 |
| 2014 | $2,399 | $80,740 | $0 | $0 |
Source: Public Records
Map
Nearby Homes
- Linden Plan at Sweetlake Grove - Bungalow Series
- 4690 Glore Rd SW
- 8009 Haven Springs Trace
- 8029 Haven Springs Trace
- 8025 Haven Springs Trace
- 8041 Haven Springs Trace
- 4612 Springside Ct SW
- 960 Verlander Trail
- 4556 Sweetlake Rd SW
- 971 Verlander Trail
- 1078 Hibiscus Way SW
- 1021 Wisteria Dr SW
- 1240 Parktown Dr Unit 4
- Kaufman Plan at Wilkins Walk
- Bryson Plan at Wilkins Walk
- Brooks Plan at Wilkins Walk
- 4569 Moray Dr
- 4581 Moray Dr
- 4589 Moray Dr
- 4561 Moray Dr
- 4566 Glore Crossing Dr SW
- 4570 Glore Crossing Dr SW
- 4564 Glore Crossing Dr SW
- 4561 Glore Crossing Dr SW
- 4563 Glore Crossing Dr SW
- 4572 Glore Crossing Dr SW
- 0 Abram Ct
- 4562 Glore Crossing Dr SW
- 4565 Glore Crossing Dr SW
- 1153 Abram Ct SW
- 4574 Glore Crossing Dr SW
- 1154 Abram Ct SW
- 4567 Glore Crossing Dr SW
- 4560 Glore Crossing Dr SW
- 4678 Glore Rd SW Unit 37234569
- 4678 Glore Rd SW Unit 37234556
- 4678 Glore Rd SW Unit 37234493
- 4678 Glore Rd SW Unit 37234191
- 4678 Glore Rd SW Unit 37168493
- 4678 Glore Rd SW Unit 37168182