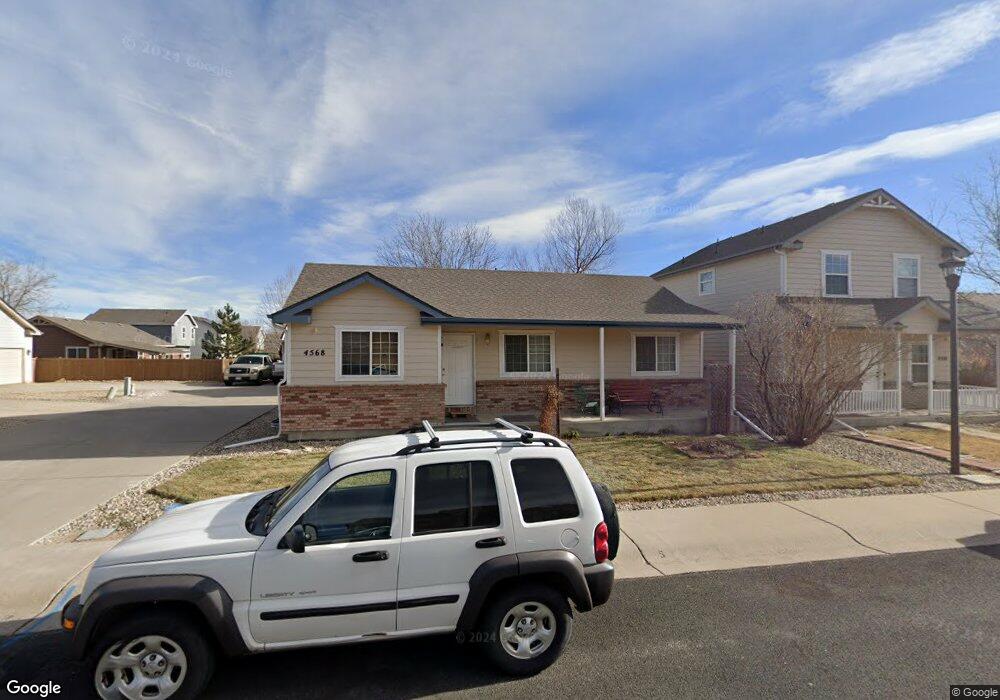
4568 Mead Place Loveland, CO 80538
Estimated Value: $437,203 - $458,000
3
Beds
2
Baths
1,088
Sq Ft
$414/Sq Ft
Est. Value
About This Home
This home is located at 4568 Mead Place, Loveland, CO 80538 and is currently estimated at $450,051, approximately $413 per square foot. 4568 Mead Place is a home located in Larimer County with nearby schools including Centennial Elementary School, Lucile Erwin Middle School, and Loveland High School.
Ownership History
Date
Name
Owned For
Owner Type
Purchase Details
Closed on
May 15, 2019
Sold by
Garnand Nanci J
Bought by
Nanci Garnand Living Trust
Current Estimated Value
Purchase Details
Closed on
Nov 2, 2011
Sold by
Holt Christopher and Holt Kristin
Bought by
Garnand Nanci J
Home Financials for this Owner
Home Financials are based on the most recent Mortgage that was taken out on this home.
Original Mortgage
$138,750
Outstanding Balance
$95,161
Interest Rate
4.14%
Mortgage Type
New Conventional
Estimated Equity
$354,890
Purchase Details
Closed on
Oct 7, 2003
Sold by
Giuliano & Father Construction Inc
Bought by
Holt Christopher and Holt Kristin
Home Financials for this Owner
Home Financials are based on the most recent Mortgage that was taken out on this home.
Original Mortgage
$146,000
Interest Rate
6.42%
Mortgage Type
Unknown
Create a Home Valuation Report for This Property
The Home Valuation Report is an in-depth analysis detailing your home's value as well as a comparison with similar homes in the area
Home Values in the Area
Average Home Value in this Area
Purchase History
| Date | Buyer | Sale Price | Title Company |
|---|---|---|---|
| Nanci Garnand Living Trust | -- | None Available | |
| Garnand Nanci J | $185,000 | Land Title Guarantee Company | |
| Holt Christopher | $50,000 | Land Title |
Source: Public Records
Mortgage History
| Date | Status | Borrower | Loan Amount |
|---|---|---|---|
| Open | Garnand Nanci J | $138,750 | |
| Previous Owner | Holt Christopher | $146,000 |
Source: Public Records
Tax History Compared to Growth
Tax History
| Year | Tax Paid | Tax Assessment Tax Assessment Total Assessment is a certain percentage of the fair market value that is determined by local assessors to be the total taxable value of land and additions on the property. | Land | Improvement |
|---|---|---|---|---|
| 2025 | $2,148 | $30,606 | $8,375 | $22,231 |
| 2024 | $2,072 | $30,606 | $8,375 | $22,231 |
| 2022 | $1,839 | $23,116 | $4,650 | $18,466 |
| 2021 | $1,890 | $23,781 | $4,783 | $18,998 |
| 2020 | $1,783 | $22,422 | $4,783 | $17,639 |
| 2019 | $1,753 | $22,422 | $4,783 | $17,639 |
| 2018 | $1,456 | $17,691 | $4,817 | $12,874 |
| 2017 | $1,254 | $17,691 | $4,817 | $12,874 |
| 2016 | $1,207 | $16,453 | $5,325 | $11,128 |
| 2015 | $1,197 | $16,460 | $5,330 | $11,130 |
| 2014 | $1,044 | $13,890 | $5,330 | $8,560 |
Source: Public Records
Map
Nearby Homes
- 2643 W 45th St
- 2554 W 44th St
- 2597 W 46th St
- 2684 W 46th St
- 4559 Keota Place
- 2250 W 44th St
- 2465 Glen Isle Dr
- 2960 Kincaid Dr Unit 303
- 4719 Degas Dr
- 4725 Degas Dr
- 4733 Degas Dr
- 4745 Degas Dr
- 2349 Paonia St
- 2920 Donatello St
- 2070 Tonopas Ct
- 4790 Degas Dr
- 4705 Whistler Dr
- 3007 Benfold St
- 2308 Winter Park St
- 4711 Whistler Dr
- 4550 Mead Place
- 2596 W 46th St
- 2578 W 46th St
- 4530 Mead Place
- 2560 W 46th St
- 4561 Mead Place
- 4569 Mead Place
- 4553 Mead Place
- 2593 W 45th St
- 2577 W 45th St
- 4545 Mead Place
- 2561 W 45th St
- 2542 W 46th St
- 2642 W 46th St
- 2660 W 46th St
- 2545 W 45th St
- 2651 W 45th St
- 2672 W 46th St
- 2659 W 45th St
- 2524 W 46th St