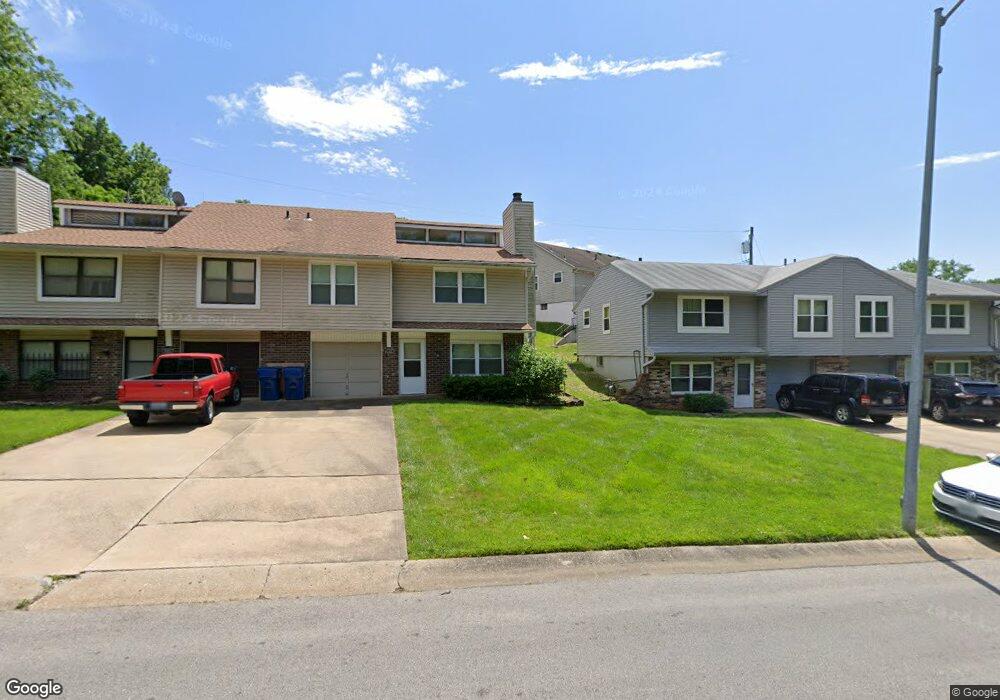
4568 S Saville Ct Independence, MO 64055
Southern NeighborhoodEstimated Value: $147,000 - $181,979
2
Beds
2
Baths
1,256
Sq Ft
$125/Sq Ft
Est. Value
About This Home
This home is located at 4568 S Saville Ct, Independence, MO 64055 and is currently estimated at $156,495, approximately $124 per square foot. 4568 S Saville Ct is a home located in Jackson County with nearby schools including William Southern Elementary School, Bridger Middle School, and Pioneer Ridge Middle School.
Ownership History
Date
Name
Owned For
Owner Type
Purchase Details
Closed on
Apr 18, 2022
Sold by
Lynda Sell
Bought by
Springate Jonathan B and Springate Jill L
Current Estimated Value
Home Financials for this Owner
Home Financials are based on the most recent Mortgage that was taken out on this home.
Original Mortgage
$57,000
Outstanding Balance
$46,954
Interest Rate
4.17%
Mortgage Type
Balloon
Estimated Equity
$109,541
Purchase Details
Closed on
Aug 21, 2000
Sold by
Ann Pierson Ruth
Bought by
Sell Donald and Sell Lynda
Home Financials for this Owner
Home Financials are based on the most recent Mortgage that was taken out on this home.
Original Mortgage
$43,320
Interest Rate
8.15%
Mortgage Type
Purchase Money Mortgage
Purchase Details
Closed on
Dec 2, 1996
Sold by
Levota Michael A and Levota Candace Sue
Bought by
Pierson Ruth Ann
Home Financials for this Owner
Home Financials are based on the most recent Mortgage that was taken out on this home.
Original Mortgage
$46,014
Interest Rate
7.77%
Mortgage Type
Seller Take Back
Create a Home Valuation Report for This Property
The Home Valuation Report is an in-depth analysis detailing your home's value as well as a comparison with similar homes in the area
Home Values in the Area
Average Home Value in this Area
Purchase History
| Date | Buyer | Sale Price | Title Company |
|---|---|---|---|
| Springate Jonathan B | -- | None Listed On Document | |
| Sell Donald | -- | Truman County Title Inc | |
| Pierson Ruth Ann | -- | -- |
Source: Public Records
Mortgage History
| Date | Status | Borrower | Loan Amount |
|---|---|---|---|
| Open | Springate Jonathan B | $57,000 | |
| Previous Owner | Sell Donald | $43,320 | |
| Previous Owner | Pierson Ruth Ann | $46,014 |
Source: Public Records
Tax History
| Year | Tax Paid | Tax Assessment Tax Assessment Total Assessment is a certain percentage of the fair market value that is determined by local assessors to be the total taxable value of land and additions on the property. | Land | Improvement |
|---|---|---|---|---|
| 2025 | $1,604 | $20,353 | $3,150 | $17,203 |
| 2024 | $1,568 | $23,157 | $718 | $22,439 |
| 2023 | $1,568 | $23,158 | $580 | $22,578 |
| 2022 | $1,137 | $15,390 | $1,310 | $14,080 |
| 2021 | $1,136 | $15,390 | $1,310 | $14,080 |
| 2020 | $1,021 | $13,435 | $1,310 | $12,125 |
| 2019 | $1,005 | $13,435 | $1,310 | $12,125 |
| 2018 | $916 | $11,693 | $1,140 | $10,553 |
| 2017 | $916 | $11,693 | $1,140 | $10,553 |
| 2016 | $902 | $11,400 | $1,330 | $10,070 |
Source: Public Records
Map
Nearby Homes
- 4543 S Saville Ct
- 14930 Tomasha Dr
- 14700 U S 40
- 15531 E 48th St
- 15521 E 48th St
- 4712 S Brentwood Ave
- 4714 S Brentwood Ave
- 4707 S Brentwood Ave
- 4705 S Brentwood Ave
- 4711 S Brentwood Ave
- 4709 S Brentwood Ave
- 15504 E 44th Terrace S
- 4517 S Fremont Rd
- 14611 E 43rd Terrace S
- 14404 E Covington Rd
- 4228 S Stayton Ave
- 4820-4900 Emery Ave
- 15412 E 42nd Place
- 5005 S Hocker Rd
- 5003 S Hocker Rd
- 4564 S Saville Ct
- 4572 S Saville Ct
- 4560 S Saville Ct
- 4576 S Saville Ct
- 4556 S Saville Ct
- 4583 S Saville Ct
- 4563 S Saville Ct
- 4581 S Saville Ct
- 4567 S Saville Ct
- 4547 S Saville Ct
- 4552 S Saville Ct
- 4548 S Saville Ct
- 4544 S Saville Ct
- 15313 E 45th Terrace S
- 15309 E 45th Terrace S
- 15305 E 45th Terrace S Unit 151
- 4540 S Saville Ct
- 15317 E 45th Terrace S
- 15301 E 45th Terrace S
- 15321 E 45th Terrace S
Your Personal Tour Guide
Ask me questions while you tour the home.