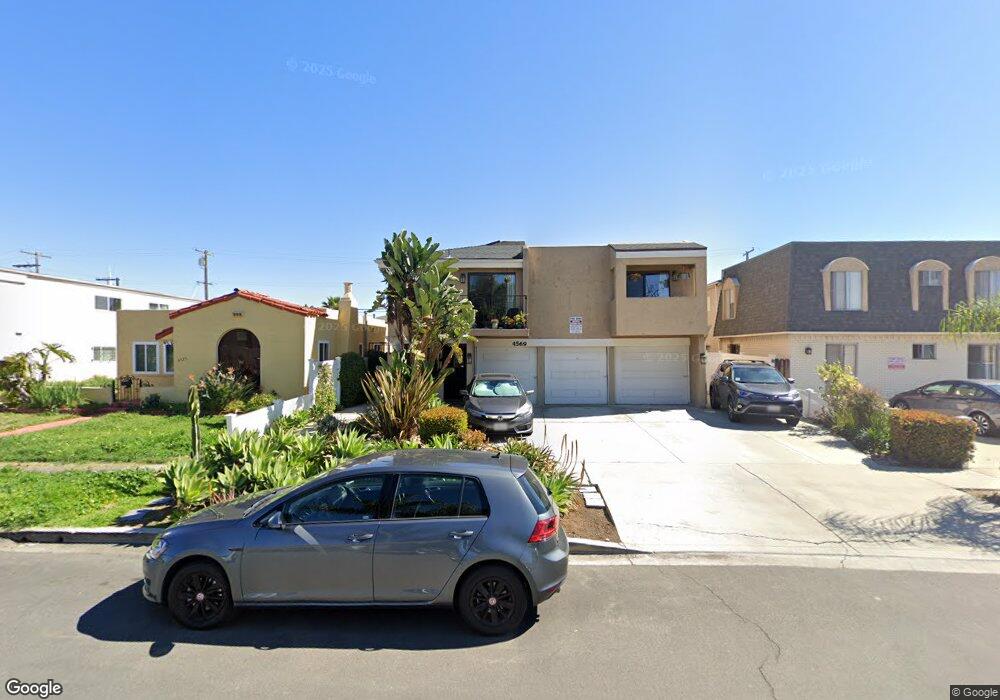
4569 Hamilton St Unit 5 San Diego, CA 92116
North Park NeighborhoodEstimated Value: $543,000 - $667,000
2
Beds
2
Baths
774
Sq Ft
$752/Sq Ft
Est. Value
About This Home
This home is located at 4569 Hamilton St Unit 5, San Diego, CA 92116 and is currently estimated at $582,309, approximately $752 per square foot. 4569 Hamilton St Unit 5 is a home located in San Diego County with nearby schools including Garfield Elementary, Roosevelt International Middle School, and San Diego Global Vision Academy.
Ownership History
Date
Name
Owned For
Owner Type
Purchase Details
Closed on
Dec 1, 2010
Sold by
Kalantar Pejhmon
Bought by
Ran Jimmy
Current Estimated Value
Home Financials for this Owner
Home Financials are based on the most recent Mortgage that was taken out on this home.
Original Mortgage
$144,000
Outstanding Balance
$95,765
Interest Rate
4.35%
Mortgage Type
New Conventional
Estimated Equity
$486,544
Purchase Details
Closed on
Sep 8, 2003
Sold by
Hodge Brian
Bought by
Kalantar Pejhmon
Home Financials for this Owner
Home Financials are based on the most recent Mortgage that was taken out on this home.
Original Mortgage
$205,600
Interest Rate
5%
Mortgage Type
Unknown
Purchase Details
Closed on
Oct 9, 2000
Sold by
Peterson Donald B
Bought by
Hodge Brian C
Home Financials for this Owner
Home Financials are based on the most recent Mortgage that was taken out on this home.
Original Mortgage
$126,800
Interest Rate
7.88%
Purchase Details
Closed on
Feb 21, 1984
Create a Home Valuation Report for This Property
The Home Valuation Report is an in-depth analysis detailing your home's value as well as a comparison with similar homes in the area
Home Values in the Area
Average Home Value in this Area
Purchase History
| Date | Buyer | Sale Price | Title Company |
|---|---|---|---|
| Ran Jimmy | $180,000 | Stewart Title | |
| Kalantar Pejhmon | $257,000 | Lawyers Title | |
| Hodge Brian C | $133,500 | Chicago Title Co | |
| -- | $59,000 | -- |
Source: Public Records
Mortgage History
| Date | Status | Borrower | Loan Amount |
|---|---|---|---|
| Open | Ran Jimmy | $144,000 | |
| Previous Owner | Kalantar Pejhmon | $205,600 | |
| Previous Owner | Hodge Brian C | $126,800 | |
| Closed | Kalantar Pejhmon | $38,550 |
Source: Public Records
Tax History Compared to Growth
Tax History
| Year | Tax Paid | Tax Assessment Tax Assessment Total Assessment is a certain percentage of the fair market value that is determined by local assessors to be the total taxable value of land and additions on the property. | Land | Improvement |
|---|---|---|---|---|
| 2025 | $2,808 | $230,597 | $131,955 | $98,642 |
| 2024 | $2,808 | $226,076 | $129,368 | $96,708 |
| 2023 | $2,746 | $221,644 | $126,832 | $94,812 |
| 2022 | $2,673 | $217,299 | $124,346 | $92,953 |
| 2021 | $2,655 | $213,039 | $121,908 | $91,131 |
| 2020 | $2,623 | $210,855 | $120,658 | $90,197 |
| 2019 | $2,577 | $206,722 | $118,293 | $88,429 |
| 2018 | $2,411 | $202,670 | $115,974 | $86,696 |
| 2017 | $80 | $198,697 | $113,700 | $84,997 |
| 2016 | $2,316 | $194,802 | $111,471 | $83,331 |
| 2015 | $2,282 | $191,877 | $109,797 | $82,080 |
| 2014 | $2,247 | $188,120 | $107,647 | $80,473 |
Source: Public Records
Map
Nearby Homes
- 4503 Hamilton St Unit 4
- 4612 Hamilton St
- 4545 Arizona St Unit 101
- 4545 Arizona St Unit 107
- 4518 Arizona St
- 4665 Oregon St Unit 6
- 4657 Idaho St
- 4502 Texas St
- 4722 Oregon St
- 4714-16 Arizona St
- 2820 Adams Ave
- 2717 Meade Ave
- 4479 Louisiana St Unit 7
- 2436 Adams Ave
- 4381 Oregon St Unit 6
- 4425 Louisiana St Unit 2
- 4367 Idaho St Unit 5
- 4329 Idaho St Unit 104
- 4355 Utah St Unit 2
- 4838 Idaho St
- 4569 Hamilton St
- 4569 Hamilton St Unit 7
- 4569 Hamilton St Unit 6
- 4569 Hamilton St Unit 4
- 4569 Hamilton St Unit 3
- 4569 Hamilton St Unit 2
- 4569 Hamilton St Unit 1
- 4559 Hamilton St
- 4575 Hamilton St Unit 79
- 4585 Hamilton St
- 4551 Hamilton St Unit 6
- 4551 Hamilton St
- 4551-4553 Hamilton St
- 4541 Hamilton St
- 2605 Madison Ave
- 4566 Oregon St Unit 72
- 4574 Oregon St Unit 80
- 4552 Oregon St
- 4586 Oregon St Unit 90
- 4544 Oregon St