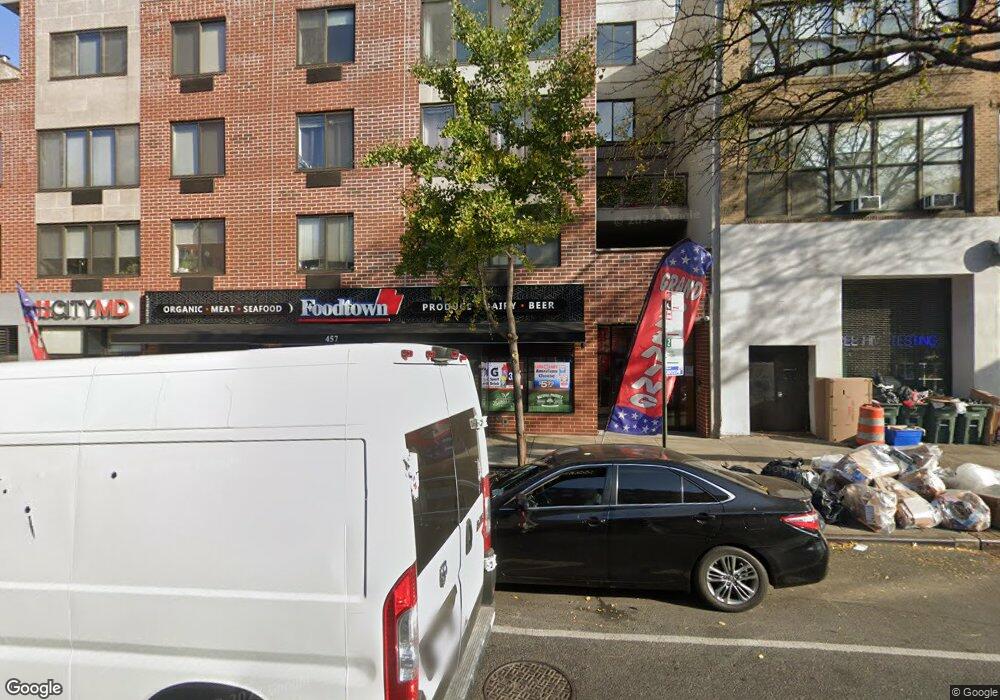
457 Atlantic Ave Unit 3A467 Brooklyn, NY 11217
Boerum Hill NeighborhoodEstimated Value: $1,325,000 - $1,792,000
--
Bed
--
Bath
980
Sq Ft
$1,534/Sq Ft
Est. Value
About This Home
This home is located at 457 Atlantic Ave Unit 3A467, Brooklyn, NY 11217 and is currently estimated at $1,503,343, approximately $1,534 per square foot. 457 Atlantic Ave Unit 3A467 is a home located in Kings County with nearby schools including P.S. 38 The Pacific School, A. Fantis School of Saints Constantine and Helen Cathedral, and MUSE Academy.
Ownership History
Date
Name
Owned For
Owner Type
Purchase Details
Closed on
Jul 20, 2018
Sold by
Kastenbaum Steven and Sinderbrand Joy
Bought by
Aguilar Carlos
Current Estimated Value
Home Financials for this Owner
Home Financials are based on the most recent Mortgage that was taken out on this home.
Original Mortgage
$522,198
Outstanding Balance
$452,563
Interest Rate
4.5%
Mortgage Type
New Conventional
Estimated Equity
$1,050,780
Purchase Details
Closed on
Aug 15, 2008
Sold by
457-467 Atlantic Llc
Bought by
Kastenbaum Steve and Sinderbrand Joy
Home Financials for this Owner
Home Financials are based on the most recent Mortgage that was taken out on this home.
Original Mortgage
$603,200
Interest Rate
6.29%
Mortgage Type
Purchase Money Mortgage
Create a Home Valuation Report for This Property
The Home Valuation Report is an in-depth analysis detailing your home's value as well as a comparison with similar homes in the area
Home Values in the Area
Average Home Value in this Area
Purchase History
| Date | Buyer | Sale Price | Title Company |
|---|---|---|---|
| Aguilar Carlos | $1,315,000 | -- | |
| Kastenbaum Steve | $754,000 | -- | |
| Kastenbaum Steve | $754,000 | -- |
Source: Public Records
Mortgage History
| Date | Status | Borrower | Loan Amount |
|---|---|---|---|
| Open | Aguilar Carlos | $522,198 | |
| Previous Owner | Kastenbaum Steve | $603,200 |
Source: Public Records
Tax History Compared to Growth
Tax History
| Year | Tax Paid | Tax Assessment Tax Assessment Total Assessment is a certain percentage of the fair market value that is determined by local assessors to be the total taxable value of land and additions on the property. | Land | Improvement |
|---|---|---|---|---|
| 2025 | $14,315 | $155,286 | $11,980 | $143,306 |
| 2024 | $14,315 | $141,318 | $11,980 | $129,338 |
| 2023 | $10,597 | $128,530 | $11,980 | $116,550 |
| 2022 | $7,598 | $116,576 | $11,980 | $104,596 |
| 2021 | $4,978 | $86,554 | $11,980 | $74,574 |
| 2020 | $1,540 | $99,534 | $11,980 | $87,554 |
| 2019 | $1,252 | $96,324 | $11,980 | $84,344 |
| 2018 | $1,263 | $85,401 | $11,980 | $73,421 |
| 2017 | $1,263 | $82,383 | $11,980 | $70,403 |
| 2016 | $1,280 | $76,346 | $11,981 | $64,365 |
| 2015 | $1,000 | $68,360 | $11,981 | $56,379 |
| 2014 | $1,000 | $63,173 | $11,980 | $51,193 |
Source: Public Records
Map
Nearby Homes
- 483 Atlantic Ave
- 457 Atlantic Ave Unit 2A
- 467 Pacific St Unit 22
- 467 Pacific St Unit 10
- 52 3rd Ave Unit 1A
- 497 Pacific St Unit 3C
- 319 Schermerhorn St Unit 4A
- 319 Schermerhorn St Unit 20B
- 319 Schermerhorn St Unit 8B
- 319 Schermerhorn St Unit 4E
- 509 Pacific St Unit 3-H
- 433 Pacific St
- 422 State St Unit 6
- 424 Atlantic Ave Unit MULTIFAM
- 537 Pacific St
- 229 Dean St
- 227 Dean St
- 556 State St Unit 3-CN
- 560 State St Unit 9B
- 560 State St Unit 7A
- 457 Atlantic Ave Unit 4B
- 457 Atlantic Ave Unit 6D
- 457 Atlantic Ave Unit 467
- 457 Atlantic Ave Unit 467
- 457 Atlantic Ave Unit 7C467
- 457 Atlantic Ave Unit 7B467
- 457 Atlantic Ave Unit 7A467
- 457 Atlantic Ave Unit 6D467
- 457 Atlantic Ave Unit 6C467
- 457 Atlantic Ave Unit 5B467
- 457 Atlantic Ave Unit 5A467
- 457 Atlantic Ave Unit 4D467
- 457 Atlantic Ave Unit 4C467
- 457 Atlantic Ave Unit 4B467
- 457 Atlantic Ave Unit 4A467
- 457 Atlantic Ave Unit 3D467
- 457 Atlantic Ave Unit 3C467
- 457 Atlantic Ave Unit 3B467
- 457 Atlantic Ave Unit 2D467
- 457 Atlantic Ave Unit 2C467