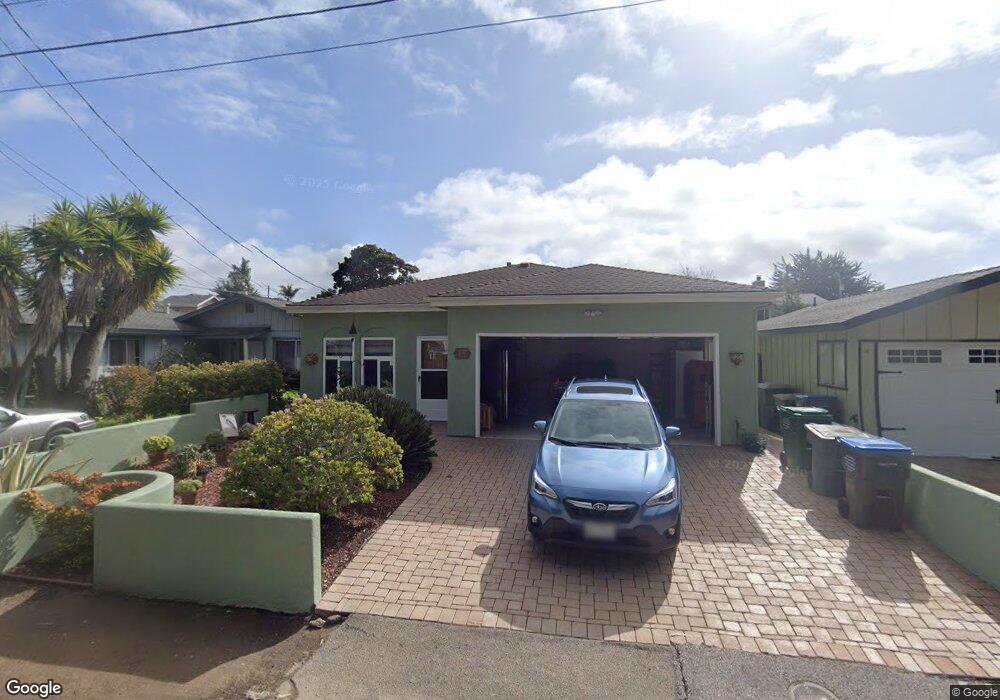
457 Binscarth Rd Los Osos, CA 93402
Estimated Value: $722,000 - $855,000
2
Beds
2
Baths
1,000
Sq Ft
$795/Sq Ft
Est. Value
About This Home
This home is located at 457 Binscarth Rd, Los Osos, CA 93402 and is currently estimated at $795,047, approximately $795 per square foot. 457 Binscarth Rd is a home located in San Luis Obispo County with nearby schools including Monarch Grove Elementary School, Los Osos Middle School, and Morro Bay High School.
Ownership History
Date
Name
Owned For
Owner Type
Purchase Details
Closed on
Oct 27, 2015
Sold by
Pettersen Bonnie A and Pettersen Clifford A
Bought by
The 2013 Pettersen Family Trust and Pettersen Clifford A
Current Estimated Value
Purchase Details
Closed on
Sep 9, 2015
Sold by
Pettersen Bonnie A and Pettersen Clifford A
Bought by
Pettersen Bonnie A and Pettersen Clifford A
Purchase Details
Closed on
Mar 8, 2013
Sold by
Pettersen Bonnie A
Bought by
Pettersen Bonnie A and Pettersen Clifford A
Purchase Details
Closed on
May 13, 2008
Sold by
Konopak Bonnie A
Bought by
Konopak Bonnie A
Home Financials for this Owner
Home Financials are based on the most recent Mortgage that was taken out on this home.
Original Mortgage
$280,500
Interest Rate
5.88%
Mortgage Type
New Conventional
Purchase Details
Closed on
May 21, 2007
Sold by
Konopak Bonnie A
Bought by
Konopak Bonnie A
Purchase Details
Closed on
Aug 2, 2000
Sold by
Konopak John
Bought by
Konopak Bonnie A
Home Financials for this Owner
Home Financials are based on the most recent Mortgage that was taken out on this home.
Original Mortgage
$168,000
Interest Rate
8.16%
Purchase Details
Closed on
Sep 1, 1999
Sold by
Willis Tracie and Yee Tracie
Bought by
Johnson Philip A and Johnson Carrie L
Home Financials for this Owner
Home Financials are based on the most recent Mortgage that was taken out on this home.
Original Mortgage
$135,200
Interest Rate
8.09%
Purchase Details
Closed on
Aug 26, 1999
Sold by
Johnson Philip A and Johnson Carrie L
Bought by
Taddeo Stewart and Taddeo Yasuyo
Home Financials for this Owner
Home Financials are based on the most recent Mortgage that was taken out on this home.
Original Mortgage
$135,200
Interest Rate
8.09%
Purchase Details
Closed on
Nov 7, 1997
Sold by
Johnson Philip A and Johnson Carrie L
Bought by
Johnson Philip A and Johnson Carrie L
Home Financials for this Owner
Home Financials are based on the most recent Mortgage that was taken out on this home.
Original Mortgage
$129,713
Interest Rate
7.33%
Mortgage Type
FHA
Purchase Details
Closed on
Jun 4, 1996
Sold by
Yee Scott M
Bought by
Yee Tracie L
Home Financials for this Owner
Home Financials are based on the most recent Mortgage that was taken out on this home.
Original Mortgage
$131,186
Interest Rate
8.01%
Mortgage Type
FHA
Create a Home Valuation Report for This Property
The Home Valuation Report is an in-depth analysis detailing your home's value as well as a comparison with similar homes in the area
Home Values in the Area
Average Home Value in this Area
Purchase History
| Date | Buyer | Sale Price | Title Company |
|---|---|---|---|
| The 2013 Pettersen Family Trust | -- | None Available | |
| Pettersen Bonnie A | -- | None Available | |
| Pettersen Bonnie A | -- | None Available | |
| Pettersen Bonnie A | -- | None Available | |
| Konopak Bonnie A | -- | Financial Title Company | |
| Konopak Bonnie A | -- | Financial Title Company | |
| Konopak Bonnie A | -- | None Available | |
| Konopak Bonnie A | -- | Chicago Title Co | |
| Konopak Bonnie A | $210,000 | Chicago Title Co | |
| Johnson Philip A | -- | Fidelity National Title Co | |
| Taddeo Stewart | $169,000 | Fidelity National Title Co | |
| Johnson Philip A | -- | Cuesta Title | |
| Yee Tracie L | -- | Chicago Title Co | |
| Johnson Philip A | $132,500 | Chicago Title Co |
Source: Public Records
Mortgage History
| Date | Status | Borrower | Loan Amount |
|---|---|---|---|
| Closed | Konopak Bonnie A | $280,500 | |
| Closed | Konopak Bonnie A | $168,000 | |
| Previous Owner | Taddeo Stewart | $135,200 | |
| Previous Owner | Johnson Philip A | $129,713 | |
| Previous Owner | Johnson Philip A | $131,186 |
Source: Public Records
Tax History Compared to Growth
Tax History
| Year | Tax Paid | Tax Assessment Tax Assessment Total Assessment is a certain percentage of the fair market value that is determined by local assessors to be the total taxable value of land and additions on the property. | Land | Improvement |
|---|---|---|---|---|
| 2025 | $7,528 | $438,123 | $135,602 | $302,521 |
| 2024 | $7,239 | $429,534 | $132,944 | $296,590 |
| 2023 | $7,239 | $421,113 | $130,338 | $290,775 |
| 2022 | $7,110 | $412,857 | $127,783 | $285,074 |
| 2021 | $6,972 | $404,763 | $125,278 | $279,485 |
| 2020 | $6,661 | $400,614 | $123,994 | $276,620 |
| 2019 | $6,612 | $392,760 | $121,563 | $271,197 |
| 2018 | $6,465 | $385,060 | $119,180 | $265,880 |
| 2017 | $6,370 | $377,511 | $116,844 | $260,667 |
| 2016 | $4,940 | $370,109 | $114,553 | $255,556 |
| 2015 | $4,880 | $364,551 | $112,833 | $251,718 |
| 2014 | $4,554 | $357,411 | $110,623 | $246,788 |
Source: Public Records
Map
Nearby Homes